BranchOut Food (BOF) Net Margin
Official company branding of branchoutfood.com (BOF)

Stable retailer demand ensures revenue predictability for BranchOut Food Inc. (BOF), although the slow adoption of GentleRoast biotechnologies is constraining rapid growth. The net profit margin helps balance these factors, while -66.40 expresses the metric's value today. Business efficiency is bolstered by the plant in Peru, where proximity to plantations reduces transportation costs and strengthens logistics.

branchoutfood.com (BOF) - Net Return on Sales from 02/21/2024 to 11/19/2026

branchoutfood.com (BOF) - metric breakdowns and financial figures
- market value and analyst target forecast:
Initial company analysis:BranchOut Food Inc.
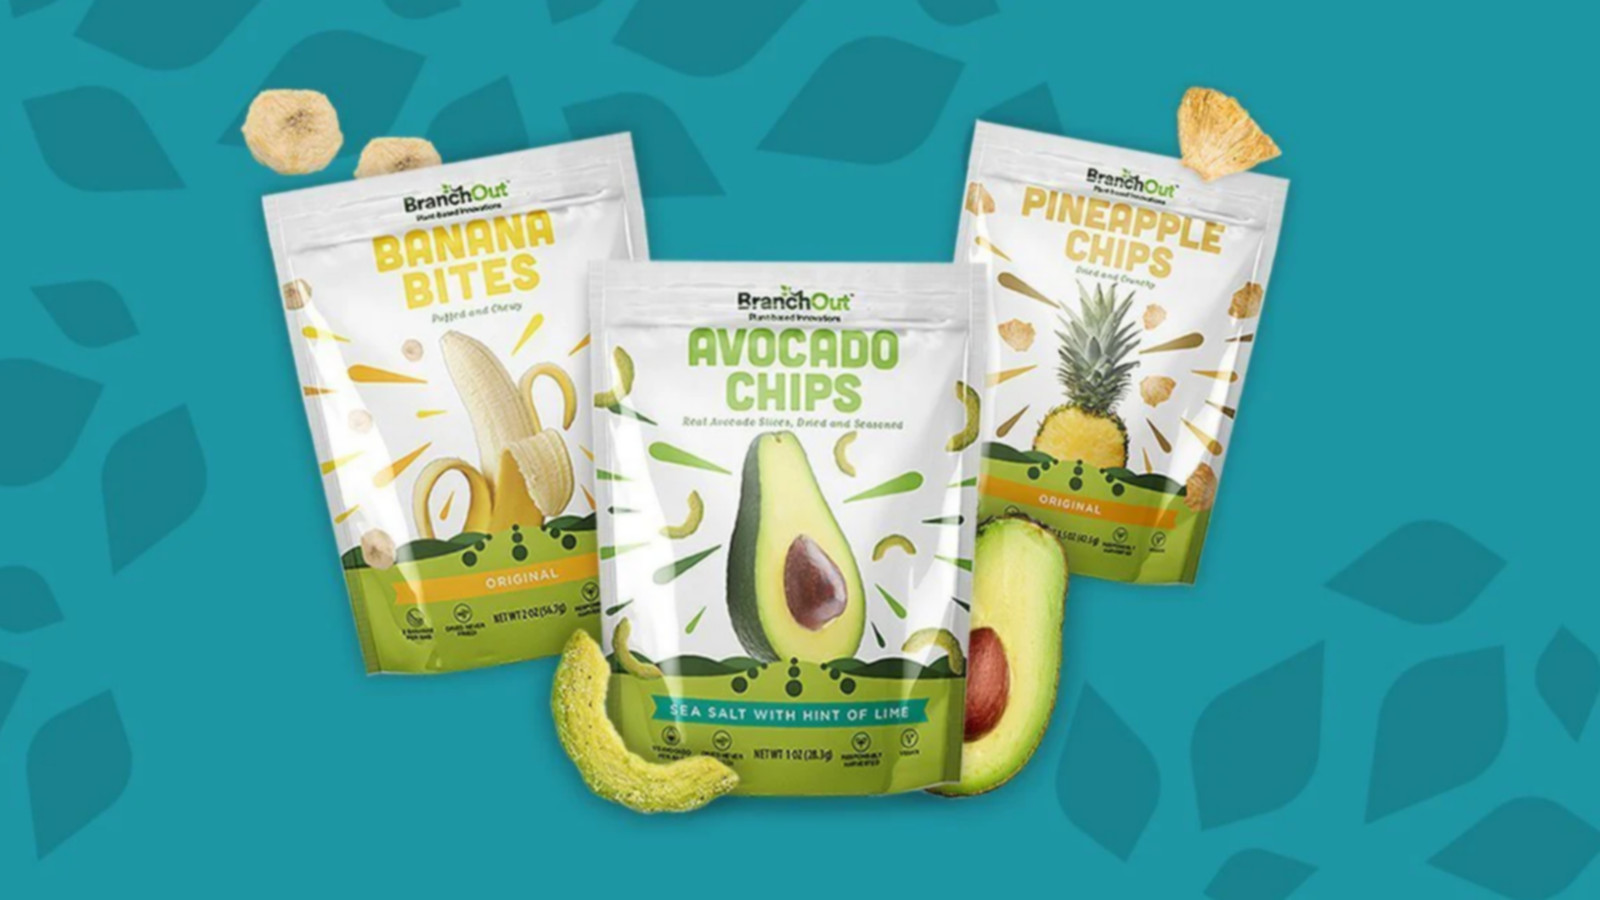
Manufactured product of BranchOut Food Inc.

To filter out the issuer's systemic risks, it is critical to assess the actual efficiency of profit generation. Sales margin determines the share of net profit in total revenue, measuring the final financial result after deducting all expenses. By analyzing the stability of the sales margin, an investor identifies hidden degradation or growth of the business between quarterly reports. For BranchOut Food Inc. (BOF), this indicator reflects the operation of operating leverage. Scaling the patented dehydration process reduces unit costs, directly increasing the final profitability.

Key competitors

Kraft Foods (KHC) - Net Margin|Net Return on Sales K|Net Margin generalmills.com|Net Margin McCormick & Co. MKC|Net Sales Margin JBS|Hormel Foods Corporation - Net Return on Sales|The J. M. Smucker Company - Return on Sales by Net Profit|PPC (Pilgrim's Pride Corporation) - Net Profit Margin|Campbell Soup - Net Sales Margin|Smithfield Foods, Inc. (SFD) - Return on Sales by Net Profit|Ingredion (INGR) - Net Margin|LW (lambweston.com) - Net Margin|BRFS (BRF S.A.) - Net Sales Margin|Post Consumer Brands (POST) - Company Sales Margin|Return on Sales by Net Profit MZTI (T. Marzetti Company)|Net Margin BRBR (BellRing Brands Corp)|Net Sales Margin TR (Tootsie Roll Industries, Inc.)|Net Profit Rate FLO|The Simply Good Foods - Net Sales Margin|Net Profit Rate NOMD (Nomad Foods)|wkkellogg.com (KLG) - Net Margin|J&J Snack Foods Corp. (JJSF) - Net Sales Margin|UTZ (Utz) - Net Sales Margin|Net Margin TreeHouse Foods THS|Net Sales Margin STKL|Company Sales Margin John B. Sanfilippo & Son, Inc.|Net Margin senecafoods.com SENEA|Lifeway Corp (LWAY) - Net Margin|MAMA: Return on Sales by Net Profit|BGS (B&G Foods, Inc.) - Net Return on Sales|BYND (Beyond Burger) - Return on Sales by Net Profit|HAIN (The Hain Celestial Group) - Net Margin|Net Margin bridgford.com|Net Return on Sales WYHG (Wing Yip Food Holdings)|Net Sales Margin LSF|Company Sales Margin Borealis Foods|Net Margin Farmer Bros. FARM|Net Profitability Margin Pinnacle Food Group|SOWG: Return on Sales by Net Profit|Net Profit Rate TWG (Top Wealth Group Holding Ltd)|steakholderfoods.com (STKH) - Net Margin|BSFC - Company Sales Margin|Net Margin Whole Earth Brands, Inc.|Net Sales Margin Lancaster Colony Corp|Net Sales Margin RGF|Stryve - Net Return on Sales|Sovos Brands, Inc. - Return on Sales by Net Profit