SOWG: Sow Good Net Margin
Corporate emblem and logo of Sow Good (SOWG)

Resource localization in the US minimizes external risks for Sow Good Inc. (SOWG). The company's net margin profile demonstrates sales profitability, where -300.70 determines the current value of the metric. Management's strategy to capture the freeze-dried dessert market is supported by the implementation of robotic lines, which reduces manual labor costs and elevates production sanitary standards.

thisissowgood.com (SOWG) Net Margin: for the period 05/03/2024 - 11/19/2026

Summary analytical data breakdowns for Sow Good (SOWG)
- share price and expert price forecast:
Comprehensive company analysis:thisissowgood.com, SOWG
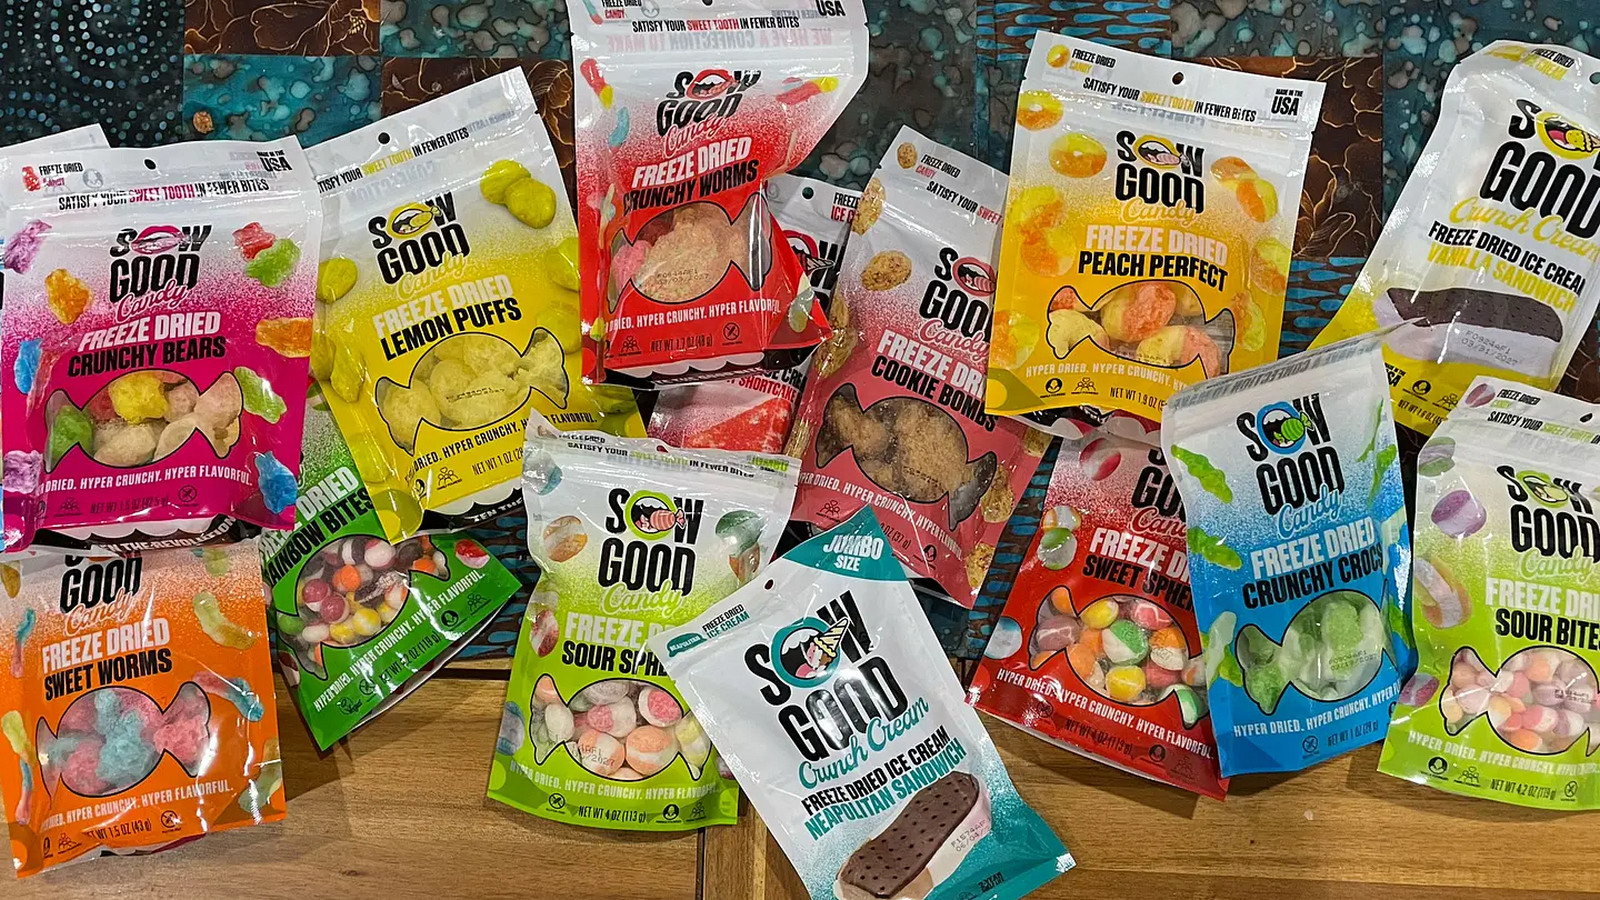
Manufactured product of thisissowgood.com

Sales margin measures the share of net profit in revenue, determining the efficiency of converting income into capital. This ratio reveals the impact of operating expenses on the final financial result. In the case of Sow Good Inc. (SOWG), costs for automating freeze-drying lines may temporarily reduce this metric. An analysis of historical net margins allows for tracking the impact of R&D investments on profitability. The stability of this metric confirms the fundamental resilience of the business model.

Main competitors

Kraft Foods (KHC) - Net Margin|Net Return on Sales K|Net Margin generalmills.com|Net Margin McCormick & Co. MKC|Net Sales Margin JBS|Hormel Foods Corporation - Net Return on Sales|The J. M. Smucker Company - Return on Sales by Net Profit|PPC (Pilgrim's Pride Corporation) - Net Profit Margin|Campbell Soup - Net Sales Margin|Smithfield Foods, Inc. (SFD) - Return on Sales by Net Profit|Ingredion (INGR) - Net Margin|LW (lambweston.com) - Net Margin|BRFS (BRF S.A.) - Net Sales Margin|Post Consumer Brands (POST) - Company Sales Margin|Return on Sales by Net Profit MZTI (T. Marzetti Company)|Net Margin BRBR (BellRing Brands Corp)|Net Sales Margin TR (Tootsie Roll Industries, Inc.)|Net Profit Rate FLO|The Simply Good Foods - Net Sales Margin|Net Profit Rate NOMD (Nomad Foods)|wkkellogg.com (KLG) - Net Margin|J&J Snack Foods Corp. (JJSF) - Net Sales Margin|UTZ (Utz) - Net Sales Margin|Net Margin TreeHouse Foods THS|Net Sales Margin STKL|Company Sales Margin John B. Sanfilippo & Son, Inc.|Net Margin senecafoods.com SENEA|Lifeway Corp (LWAY) - Net Margin|MAMA: Return on Sales by Net Profit|BGS (B&G Foods, Inc.) - Net Return on Sales|BYND (Beyond Burger) - Return on Sales by Net Profit|HAIN (The Hain Celestial Group) - Net Margin|Net Margin bridgford.com|Net Return on Sales WYHG (Wing Yip Food Holdings)|Net Sales Margin LSF|Company Sales Margin Borealis Foods|Net Margin Farmer Bros. FARM|Company Sales Margin BranchOut Food Inc. (BOF)|PFAI - Net Margin|Net Profit Rate TWG (Top Wealth Group Holding Ltd)|steakholderfoods.com (STKH) - Net Margin|BSFC - Company Sales Margin|Net Margin Whole Earth Brands, Inc.|Net Sales Margin Lancaster Colony Corp|Net Sales Margin RGF|Stryve - Net Return on Sales|Sovos Brands, Inc. - Return on Sales by Net Profit