NOMD: Nomad Foods Limited Net Margin
Corporate emblem and logo of Nomad Foods Group (NOMD)

Nomad Foods Limited (NOMD) leverages its dominance in the European market to effectively pass costs onto retailers, as clearly demonstrated by the net margin time series. The 4.50 mark serves as the current indicator for this metric. Profit stability is supported by broad geographic coverage across the EU, while ownership of historically significant brands guarantees steady sales growth for frozen foods regardless of the economic climate.

Nomad Foods Group (NOMD) Net Margin: for the period 07/04/2022 - 11/20/2026

Comprehensive metric breakdowns and analytics for Nomad Foods Group (NOMD)
- share price and expert price forecast:
Comprehensive company analysis:Nomad Foods Limited
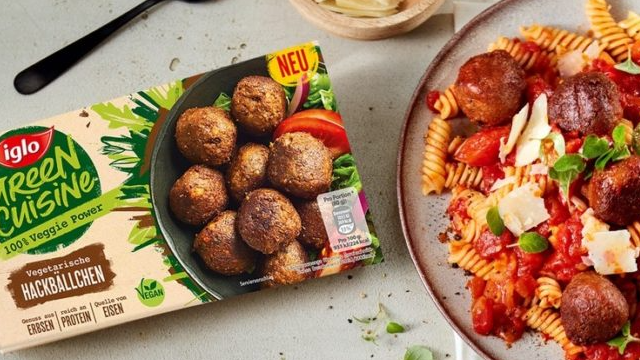
Manufactured product of Nomad Foods Corp

Stable operational processes and the management of leading European brands allow Nomad Foods Limited (NOMD) to maintain a predictable cost structure. The ratio of net income to revenue, reflected in the sales margin, quantifies the actual efficiency of asset monetization, helping investors distinguish temporary fluctuations from a systemic decline in profitability or the exhaustion of the business's growth potential.

Main competitors

Kraft Foods (KHC) - Net Margin|Net Return on Sales K|Net Margin generalmills.com|Net Margin McCormick & Co. MKC|Net Sales Margin JBS|Hormel Foods Corporation - Net Return on Sales|The J. M. Smucker Company - Return on Sales by Net Profit|PPC (Pilgrim's Pride Corporation) - Net Profit Margin|Campbell Soup - Net Sales Margin|Smithfield Foods, Inc. (SFD) - Return on Sales by Net Profit|Ingredion (INGR) - Net Margin|LW (lambweston.com) - Net Margin|BRFS (BRF S.A.) - Net Sales Margin|Post Consumer Brands (POST) - Company Sales Margin|Return on Sales by Net Profit MZTI (T. Marzetti Company)|Net Margin BRBR (BellRing Brands Corp)|Net Sales Margin TR (Tootsie Roll Industries, Inc.)|Net Profit Rate FLO|The Simply Good Foods - Net Sales Margin|KLG: Net Margin|JJSF: Net Sales Margin|Net Return on Sales UTZ|THS (TreeHouse Foods Inc) - Net Sales Margin|STKL: Net Profit Rate|Net Margin Sanfilippo (JBSS)|SENEA: Net Profit Margin|Net Margin lifewaykefir.com LWAY|Net Sales Margin Mama's Creations, Inc. MAMA|BGS - Net Margin|Beyond Meat Inc - Company Net Profitability|The Hain Celestial Group (HAIN) - Net Margin|Net Margin Bridgford Foods Corp. (BRID)|WYHG (Wing Yip Food Holdings) - Net Sales Margin|Net Margin Laird Superfood LSF|Net Margin Borealis Foods, Inc. (BRLS)|Return on Sales by Net Profit Farmer Bros Co FARM|Net Sales Margin BOF (branchoutfood.com)|Net Profitability Margin Pinnacle Food Group|SOWG: Return on Sales by Net Profit|Net Profit Rate TWG (Top Wealth Group Holding Ltd)|steakholderfoods.com (STKH) - Net Margin|BSFC - Company Sales Margin|Net Margin Whole Earth Brands, Inc.|Net Sales Margin Lancaster Colony Corp|Net Sales Margin RGF|Stryve - Net Return on Sales|Sovos Brands, Inc. - Return on Sales by Net Profit