LWAY: Lifeway Foods, Inc. Net Margin
Corporate emblem and logo of Lifeway Foods Inc (LWAY)

Lifeway Foods, Inc. (LWAY) operates a business that is resilient to market cycles due to stable demand for probiotic products. The net profit sales efficiency metric demonstrates the execution of a strategy to expand distribution and promote healthy eating, while 3.00 represents a fresh level value. Dominance in the functional beverages niche provides pricing power and reduces unit costs through production scaling.

Lifeway Corp (LWAY) Net Margin: for the period 07/04/2022 - 11/19/2026

Financial and market metric breakdowns for Lifeway Kefir (LWAY)
- share price and expert price forecast:
- market capitalization information:
Analysis of all company metrics:Lifeway Foods, Inc. - LWAY
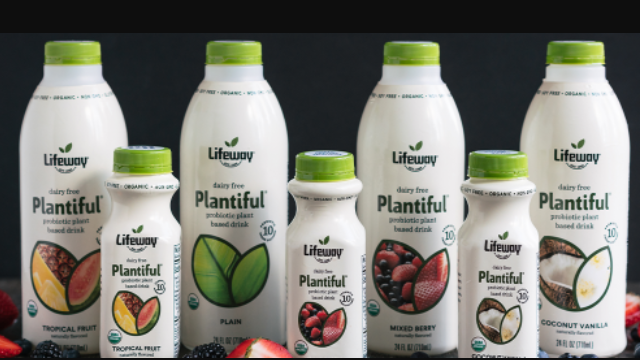
Manufactured product of Lifeway Foods Inc

Investors assess systemic capital risks by comparing an asset's market price with its actual ability to generate profit. Against the backdrop of Lifeway Foods, Inc. (LWAY) expanding into global chains and updating its probiotic line, the company's net margin reflects the profit share of every dollar of revenue, making it possible to distinguish organic business growth from operational degradation and avoid purchasing a weakened asset.

Competing companies

Kraft Foods (KHC) - Net Margin|Net Return on Sales K|Net Margin generalmills.com|Net Margin McCormick & Co. MKC|Net Sales Margin JBS|Hormel Foods Corporation - Net Return on Sales|The J. M. Smucker Company - Return on Sales by Net Profit|PPC (Pilgrim's Pride Corporation) - Net Profit Margin|Campbell Soup - Net Sales Margin|Smithfield Foods, Inc. (SFD) - Return on Sales by Net Profit|Ingredion (INGR) - Net Margin|LW (lambweston.com) - Net Margin|BRFS (BRF S.A.) - Net Sales Margin|Post Consumer Brands (POST) - Company Sales Margin|Return on Sales by Net Profit MZTI (T. Marzetti Company)|Net Margin BRBR (BellRing Brands Corp)|Net Sales Margin TR (Tootsie Roll Industries, Inc.)|Net Profit Rate FLO|The Simply Good Foods - Net Sales Margin|Net Profit Rate NOMD (Nomad Foods)|wkkellogg.com (KLG) - Net Margin|J&J Snack Foods Corp. (JJSF) - Net Sales Margin|UTZ (Utz) - Net Sales Margin|Net Margin TreeHouse Foods THS|Net Sales Margin STKL|Company Sales Margin John B. Sanfilippo & Son, Inc.|Net Margin senecafoods.com SENEA|Net Sales Margin Mama's Creations, Inc. MAMA|BGS - Net Margin|Beyond Meat Inc - Company Net Profitability|The Hain Celestial Group (HAIN) - Net Margin|Net Margin Bridgford Foods Corp. (BRID)|WYHG (Wing Yip Food Holdings) - Net Sales Margin|Net Margin Laird Superfood LSF|Net Margin Borealis Foods, Inc. (BRLS)|Return on Sales by Net Profit Farmer Bros Co FARM|Net Sales Margin BOF (branchoutfood.com)|Net Profitability Margin Pinnacle Food Group|SOWG: Return on Sales by Net Profit|Net Profit Rate TWG (Top Wealth Group Holding Ltd)|steakholderfoods.com (STKH) - Net Margin|BSFC - Company Sales Margin|Net Margin Whole Earth Brands, Inc.|Net Sales Margin Lancaster Colony Corp|Net Sales Margin RGF|Stryve - Net Return on Sales|Sovos Brands, Inc. - Return on Sales by Net Profit