FREE: Whole Earth Brands, Inc. Net Margin

Corporate emblem and logo of wholeearthbrands.com (FREE)

The net profit margin of Whole Earth Brands (FREE) reflects yield dynamics, where the parameter value equals -4.40. The company is currently finalizing a merger with a private holding, fully integrating internal processes. A portfolio of well-known brands and broad distribution protect profits from pressure by smaller players. Ownership of a healthy sweetener ecosystem guarantees stable demand through major retail chains.

wholeearthbrands.com (FREE) Net Margin: for the period 07/04/2022 - 08/10/2024

Analytical breakdowns and data insights for company wholeearthbrands.com (FREE)
- market capitalization information:
Summary company analytics:Whole Earth Brands
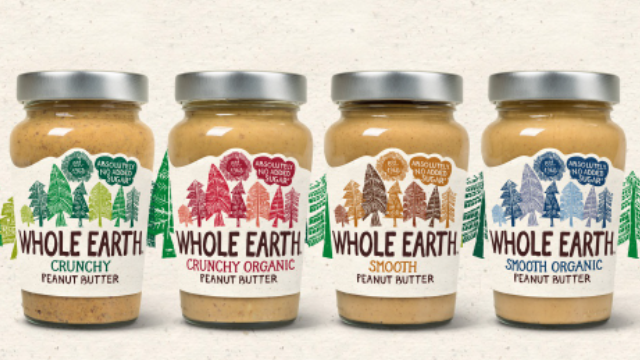
Finished products of Whole Earth Brands

Sales margins determine the efficiency of converting revenue into net profit. By analyzing net margin trends, an investor assesses a business's ability to generate income after deducting all expenses. The metric is calculated as the ratio of bottom-line profit to total sales volume. For Whole Earth Brands (FREE), the stability of this metric confirms the resilience of sweetener production to macroeconomic shocks. The low cyclicality of the food sector minimizes the risk of a sharp decline in operating returns.

Analysis of competing companies

Kraft Foods (KHC) - Net Margin|Net Return on Sales K|Net Margin generalmills.com|Net Margin McCormick & Co. MKC|Net Sales Margin JBS|Hormel Foods Corporation - Net Return on Sales|The J. M. Smucker Company - Return on Sales by Net Profit|PPC (Pilgrim's Pride Corporation) - Net Profit Margin|Campbell Soup - Net Sales Margin|Smithfield Foods, Inc. (SFD) - Return on Sales by Net Profit|Ingredion (INGR) - Net Margin|LW (lambweston.com) - Net Margin|BRFS (BRF S.A.) - Net Sales Margin|Post Consumer Brands (POST) - Company Sales Margin|Return on Sales by Net Profit MZTI (T. Marzetti Company)|Net Margin BRBR (BellRing Brands Corp)|Net Sales Margin TR (Tootsie Roll Industries, Inc.)|Net Profit Rate FLO|The Simply Good Foods - Net Sales Margin|Net Profit Rate NOMD (Nomad Foods)|wkkellogg.com (KLG) - Net Margin|J&J Snack Foods Corp. (JJSF) - Net Sales Margin|UTZ (Utz) - Net Sales Margin|Net Margin TreeHouse Foods THS|Net Sales Margin STKL|Company Sales Margin John B. Sanfilippo & Son, Inc.|Net Margin senecafoods.com SENEA|Lifeway Corp (LWAY) - Net Margin|MAMA: Return on Sales by Net Profit|BGS (B&G Foods, Inc.) - Net Return on Sales|BYND (Beyond Burger) - Return on Sales by Net Profit|HAIN (The Hain Celestial Group) - Net Margin|Net Margin bridgford.com|Net Return on Sales WYHG (Wing Yip Food Holdings)|Net Sales Margin LSF|Company Sales Margin Borealis Foods|Net Margin Farmer Bros. FARM|Company Sales Margin BranchOut Food Inc. (BOF)|PFAI - Net Margin|thisissowgood.com (SOWG) - Return on Sales by Net Profit|TWG: Net Sales Margin|STKH - Company Sales Margin|BSFC (Blue Star Foods Corporation) - Net Sales Margin|Net Sales Margin Lancaster Colony Corp|Net Sales Margin RGF|Stryve - Net Return on Sales|Sovos Brands, Inc. - Return on Sales by Net Profit