The Real Good Food (RGF) Net Margin
Public company logo of Real Good Foods (RGF)

The Real Good Food (RGF) sales margin dynamics demonstrate the implementation of ESG standards and an eco-friendly approach to packaging. However, reliance on a strict temperature-controlled delivery regime during the transport of frozen goods complicates processes. Currently, operational disruptions and a liquidity shortage create a default risk, while the value of 0.00 serves as the baseline metric for assessing the current profitability of business realization within the sector.

realgoodfoods.com (RGF) - Net Return on Sales from 07/04/2022 to 01/18/2025

The Real Good Food Company, Inc. (RGF) - metric breakdowns and financial figures
Comprehensive company analysis:The Real Good Food, RGF
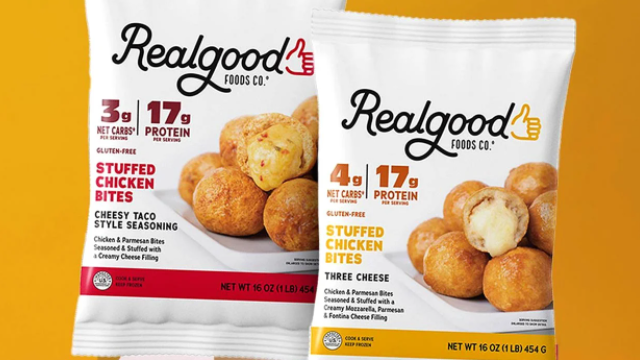
Flagship merchandise of The Real Good Food Company

This metric is calculated as the ratio of net income to revenue, providing a real-time assessment of cost management efficiency. It measures the issuer's actual financial strength by excluding the impact of one-time gains. For The Real Good Food (RGF), the increase in the net income margin confirms the successful scaling of protein product production. It is critical for investors to distinguish systemic profitability growth from random spikes. By analyzing this chart, one can evaluate the sustainability of cash flows during the expansion of the retail footprint.

Who The Real Good Food competes with

Kraft Foods (KHC) - Net Margin|Net Return on Sales K|Net Margin generalmills.com|Net Margin McCormick & Co. MKC|Net Sales Margin JBS|Hormel Foods Corporation - Net Return on Sales|The J. M. Smucker Company - Return on Sales by Net Profit|PPC (Pilgrim's Pride Corporation) - Net Profit Margin|Campbell Soup - Net Sales Margin|Smithfield Foods, Inc. (SFD) - Return on Sales by Net Profit|Ingredion (INGR) - Net Margin|LW (lambweston.com) - Net Margin|BRFS (BRF S.A.) - Net Sales Margin|Post Consumer Brands (POST) - Company Sales Margin|Return on Sales by Net Profit MZTI (T. Marzetti Company)|Net Margin BRBR (BellRing Brands Corp)|Net Sales Margin TR (Tootsie Roll Industries, Inc.)|Net Profit Rate FLO|The Simply Good Foods - Net Sales Margin|Net Profit Rate NOMD (Nomad Foods)|wkkellogg.com (KLG) - Net Margin|J&J Snack Foods Corp. (JJSF) - Net Sales Margin|UTZ (Utz) - Net Sales Margin|Net Margin TreeHouse Foods THS|Net Sales Margin STKL|Company Sales Margin John B. Sanfilippo & Son, Inc.|Net Margin senecafoods.com SENEA|Lifeway Corp (LWAY) - Net Margin|MAMA: Return on Sales by Net Profit|BGS (B&G Foods, Inc.) - Net Return on Sales|BYND (Beyond Burger) - Return on Sales by Net Profit|HAIN (The Hain Celestial Group) - Net Margin|Net Margin bridgford.com|Net Return on Sales WYHG (Wing Yip Food Holdings)|Net Sales Margin LSF|Company Sales Margin Borealis Foods|Net Margin Farmer Bros. FARM|Company Sales Margin BranchOut Food Inc. (BOF)|PFAI - Net Margin|thisissowgood.com (SOWG) - Return on Sales by Net Profit|TWG: Net Sales Margin|STKH - Company Sales Margin|BSFC (Blue Star Foods Corporation) - Net Sales Margin|Whole Earth Brands (FREE) - Company Sales Margin|Net Margin Lancaster Colony (LANC)|Stryve - Net Return on Sales|Sovos Brands, Inc. - Return on Sales by Net Profit