lambweston.com (LW) - Business Payback Period
Corporate emblem and logo of Lamb Weston Inc. (LW)

The expected P/E of Lamb Weston Holdings (LW) on the GURU.Markets interface demonstrates the impact of efficient temperature logistics and an extensive network of plants, with the 28.70 metric determining this level. Current price action is driven by software glitches and falling demand, which is putting pressure on management. However, long-term agreements with fast-food chains guarantee a stable inflow of capital, supporting the business's resilience.

Lamb Weston Holdings, Inc. (LW) P/E Multiple: for the period 07/04/2022 - 11/18/2026

Comprehensive metric breakdowns and analytics for Lamb Weston Holdings Inc (LW)
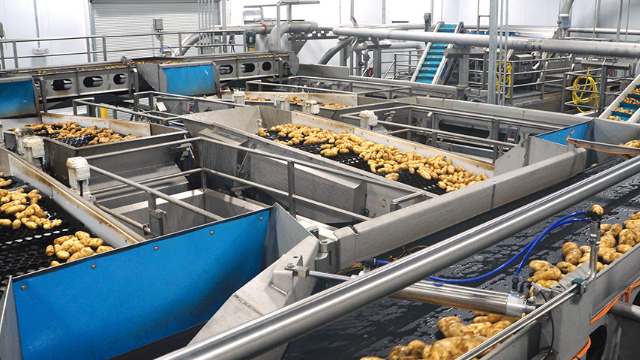
- current price and projected stock value:
General company analysis:Lamb Weston Holdings Inc - LW
Original product of Lamb Weston Holdings, Inc.

The P/E ratio reflects the cost of a single unit of net profit, allowing an investor to assess whether an asset is overpriced or undervalued relative to actual earnings. By analyzing the current market P/E of Lamb Weston Holdings (LW), market participants determine the fundamental stability of Lamb Weston Holdings (LW), whose business model is based on stable supplies of frozen potatoes and vegetables to global retail and fast-food chains.

Key competitors

Kraft Heinz Company (KHC) - Business Payback Period|Price to Earnings Ratio Kellanova Corp (K)|General Mills Corp - Price to Earnings Multiple|P/E Multiple MKC (mccormickcorporation.com)|Business Payback Period JBS N.V. (JBS)|HRL - Price to Earnings Ratio|Business Payback Period Smucker's SJM|PPC: P/E Multiple|Campbell Soup Co. - Company Value to Net Income|SFD (Smithfield) - P/E Multiple|INGR: Company Value to Net Income|P/E Multiple BRFS|POST - Market Cap to Earnings|P/E Multiple MZTI (The Marzetti Co)|BRBR: Price to Earnings Multiple|TR - Price to Earnings Ratio|Market Cap to Net Income FLO|SMPL: P/E Multiple|Market Cap to Net Income NOMD (Nomad Foods Ltd)|Price to Earnings Ratio wkkellogg.com|Market Cap to Earnings J&J Snack Foods Inc JJSF|P/E Multiple UTZ|TreeHouse Foods - Price to Earnings Multiple|P/E Multiple STKL (SunOpta Corp)|JBSS: Price to Earnings Multiple|Seneca Foods - P/E Multiple|LWAY: Price to Earnings Ratio|MAMA: P/E Multiple|Market Cap to Net Income Ratio B&G Foods BGS|Price to Earnings Ratio BYND|Market Cap to Earnings Hain Celestial HAIN|P/E Multiple BRID|Wing Yip Food Group (WYHG) - Market Cap to Net Income Ratio|Laird Superfood, Inc. - Price to Earnings Ratio|P/E Multiple Borealis Foods, Inc. BRLS|FARM - Price to Earnings Ratio|Market Cap to Earnings BranchOut Food, Inc.|Pinnacle Food Group Inc (PFAI) - Price to Earnings Ratio|Market Cap to Earnings Sow Good Inc (SOWG)|Price to Earnings Ratio TWG|Price to Earnings Ratio STKH|Price to Earnings Ratio Blue Star Foods Corp (BSFC)|FREE (Whole Earth) - Company Value to Net Income|Lancaster Colony Corp. - Price to Earnings Ratio|Real Good Foods (RGF) - Market Cap to Earnings|Stryve Foods - P/E Multiple|SOVO (sovosbrands.com) - Price to Earnings Multiple