LW: Lamb Weston Inc. Price-to-Sales Ratio
Symbol and logo of brand Lamb Weston Corp (LW)

Lamb Weston Holdings (LW) owns a network of plants in North America located near fields to ensure stable supplies. A team of agronomists and engineers provides reliable employment and social guarantees. The price-to-sales ratio demonstrates the market valuation of the business, with 1.10 reflecting the latest level of the metric. Simultaneously, the company is implementing water purification systems and reducing volumes of organic waste.

LW Lamb Weston Corp Price-to-Revenue Ratio (07/04/2022 - 11/18/2026)

Metric breakdowns and analytics for Lamb Weston Holdings (LW)
- market capitalization information:
General company analysis:LW Lamb Weston Holdings, Inc.
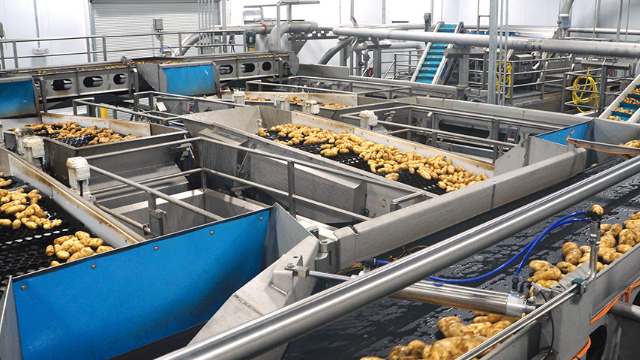
Manufactured products of Lamb Weston Inc.

The P/S ratio compares market capitalization to annual revenue, allowing an investor to assess the real value of a business regardless of current profitability. Analyzing the current P/S level reveals how the defensive status of Lamb Weston Holdings (LW) within the consumer staples sector and its inflation resilience ensure valuation stability even amidst volatile market price action.

Competitors of Lamb Weston Holdings

Kraft Heinz Corp - Market Cap to Revenue Ratio|Price-to-Revenue Ratio kelloggcompany.com K|Market Capitalization-to-Revenue Ratio GIS|McCormick & Co. - P/S Multiple|Price-to-Sales Ratio JBS|Hormel Corp (HRL) - Price-to-Revenue Ratio|Price to Sales J.M. Smucker (SJM)|Price-to-Revenue Ratio pilgrims.com|Price to Sales Campbell Soup Co. CPB|P/S Multiple SFD|INGR - Price to Sales|P/S Multiple BRFS (Sadia)|POST: Market Cap to Revenue Ratio|MZTI: Market Cap to Revenue|BRBR: Price-to-Revenue Ratio|TR (Tootsie Roll Industries Inc) - Market Cap to Revenue|Price to Sales Flowers Foods (FLO)|SMPL (Simply Good Foods Co.) - P/S Multiple|Market Cap to Revenue Nomad Foods (NOMD)|P/S Multiple KLG|JJSF (J&J Snack Foods Inc) - Market Capitalization-to-Revenue Ratio|Price-to-Revenue Ratio Utz Brands, Inc. UTZ|TreeHouse Foods (THS) - Price to Sales|STKL: Market Cap to Revenue|JBSS: Price-to-Revenue Ratio|SENEA: P/S Multiple|Price to Sales Lifeway Foods, Inc. (LWAY)|Price-to-Revenue Ratio Mama's Creations, Inc.|B&G Foods (BGS) - Price-to-Revenue Coefficient|P/S Multiple BYND|HAIN (The Hain Celestial Group) - Market Capitalization-to-Revenue Ratio|Bridgford Foods Corp - Market Cap to Revenue|WYHG (Wing Yip Food) - Price-to-Sales Ratio|Laird Superfood - P/S Multiple|Price to Sales Borealis Foods, Inc.|FARM (Farmer Bros. Co.) - Market Cap to Revenue|Price to Sales BranchOut Food, Inc. (BOF)|PFAI (Pinnacle Food Group Inc.) - P/S Multiple|thisissowgood.com (SOWG) - Price-to-Revenue Coefficient|Market Cap to Revenue TWG (Top Wealth Group Ltd)|STKH - Price to Sales|Price-to-Revenue Ratio bluestarfoods.com BSFC|P/S Multiple Whole Earth Brands FREE|LANC: Market Cap to Revenue|Price to Sales The Real Good Food Company Inc.|SNAX (stryve.com) - Market Cap to Revenue|SOVO - Price-to-Revenue Coefficient