NOMD: Nomad Foods Group Market Cap to Revenue Ratio
Corporate company logo of Nomad Foods Corp (NOMD)

The price-to-sales dynamics on GURU.Markets help assess the margin stability and FCF of Nomad Foods Limited (NOMD), the largest European frozen food producer. Expansion through acquisitions and eco-lines strengthens its market grip, while steady demand for ready-made meals guarantees a consistent cash flow. The current 0.50 metric represents a fresh level, allowing for the identification of market anomalies and confirming the institutional quality of the NOMD asset.

NOMD: Nomad Foods Group P/S Multiple 07/04/2022 - 11/15/2026

Metric breakdowns and analytics for Nomad Foods Ltd (NOMD)
- current quotes and average value forecast:
General company analysis:Nomad Foods Ltd (NOMD)
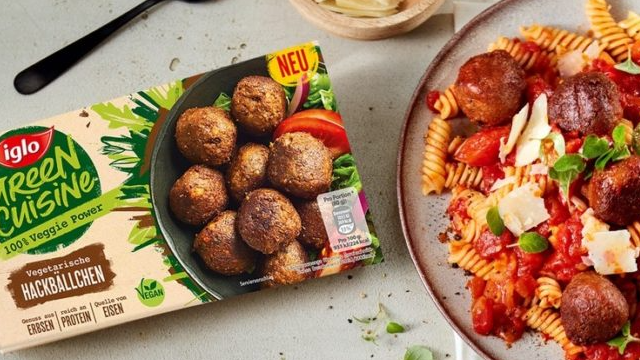
Mass-produced product of Nomad Foods

A stable workforce in logistics and e-commerce ensures operational efficiency for Nomad Foods Limited (NOMD), strengthening the issuer's market position. By analyzing the current price-to-sales ratio, an investor assesses market capitalization relative to sales volumes, which allows for the identification of asset overheating and the determination of the risk of entering at the peak of euphoria by comparing the business value with its actual revenue stream.

Competitors of Nomad Foods Limited

Kraft Heinz Corp - Market Cap to Revenue Ratio|Price-to-Revenue Ratio kelloggcompany.com K|Market Capitalization-to-Revenue Ratio GIS|McCormick & Co. - P/S Multiple|Price-to-Sales Ratio JBS|Hormel Corp (HRL) - Price-to-Revenue Ratio|Price to Sales J.M. Smucker (SJM)|Price-to-Revenue Ratio pilgrims.com|Price to Sales Campbell Soup Co. CPB|P/S Multiple SFD|INGR - Price to Sales|P/S Multiple LW (lambweston.com)|BRFS: Market Cap to Revenue Ratio|POST - Price-to-Revenue Ratio|T. Marzetti Company - Market Cap to Sales Volume|BRBR: P/S Multiple|TR: Market Cap to Sales Volume|Market Cap to Revenue FLO|Price to Sales The Simply Good Foods Company SMPL|P/S Multiple KLG|JJSF (J&J Snack Foods Inc) - Market Capitalization-to-Revenue Ratio|Price-to-Revenue Ratio Utz Brands, Inc. UTZ|TreeHouse Foods (THS) - Price to Sales|STKL: Market Cap to Revenue|JBSS: Price-to-Revenue Ratio|SENEA: P/S Multiple|Price to Sales Lifeway Foods, Inc. (LWAY)|Price-to-Revenue Ratio Mama's Creations, Inc.|B&G Foods (BGS) - Price-to-Revenue Coefficient|P/S Multiple BYND|HAIN (The Hain Celestial Group) - Market Capitalization-to-Revenue Ratio|Bridgford Foods Corp - Market Cap to Revenue|WYHG (Wing Yip Food) - Price-to-Sales Ratio|Laird Superfood - P/S Multiple|Price to Sales Borealis Foods, Inc.|FARM (Farmer Bros. Co.) - Market Cap to Revenue|Price to Sales BranchOut Food, Inc. (BOF)|PFAI (Pinnacle Food Group Inc.) - P/S Multiple|thisissowgood.com (SOWG) - Price-to-Revenue Coefficient|Market Cap to Revenue TWG (Top Wealth Group Ltd)|STKH - Price to Sales|Price-to-Revenue Ratio bluestarfoods.com BSFC|P/S Multiple Whole Earth Brands FREE|LANC: Market Cap to Revenue|Price to Sales The Real Good Food Company Inc.|SNAX (stryve.com) - Market Cap to Revenue|SOVO - Price-to-Revenue Coefficient