branchoutfood.com (BOF) Price to Earnings Multiple
Corporate emblem and logo of BranchOut Food (BOF)

The market value dynamics serve as an indicator for BranchOut Food Inc. (BOF), whose strategy combines innovative GentleDry dehydration and a dedicated team of technologists, creating a closed distribution system. The current figure is -3.90. The business relies on the production of dried plant-based ingredients, where long-term agreements with retail chains and the demand for healthy snacks ensure full utilization of production lines.

BranchOut Food (BOF) Price to Earnings Ratio: for the period 02/21/2024 - 11/11/2026
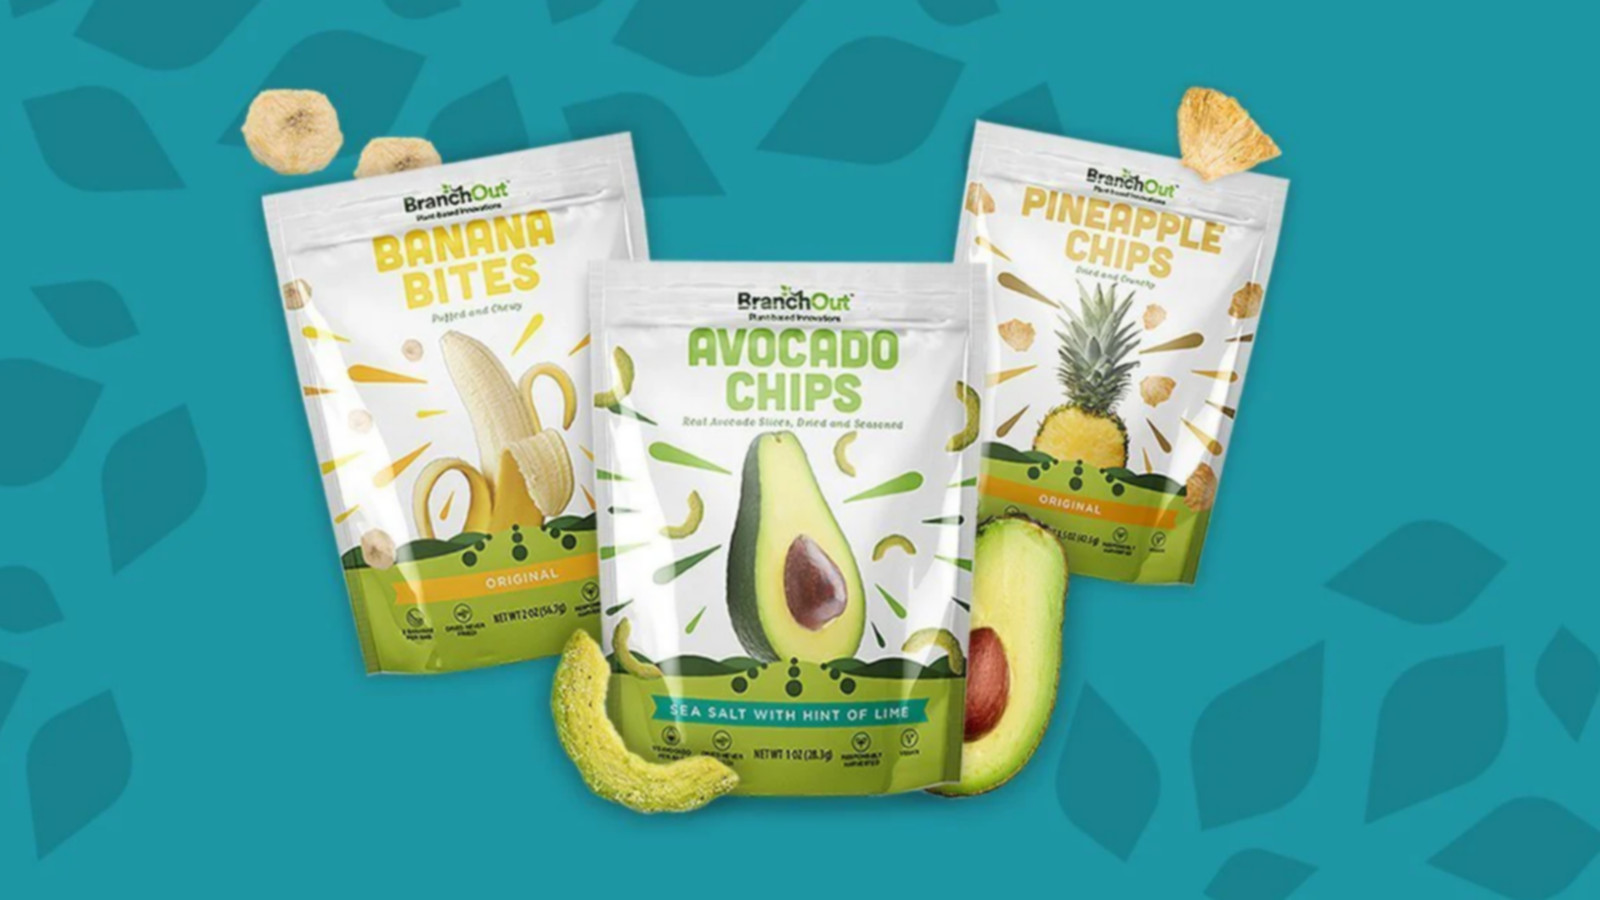
Flagship merchandise of BranchOut Food

Conservative capital requires a transparent valuation of business value relative to earnings to minimize risks when entering an asset. The P/E ratio dynamics for BranchOut Food Inc. (BOF) reflect the investment payback period, signaling that the asset is overbought when market demand outpaces the actual earnings of BranchOut Food Inc., which are limited by a narrow specialization in vacuum dehydration and a dependence on agricultural supply chains.

Competing companies

kraftheinzcompany.com (KHC) - Business Payback Period|Price to Earnings Ratio Kellogg's (K)|General Mills Inc - Price to Earnings Multiple|P/E Multiple MKC (McCormick & Co.)|Business Payback Period JBS USA (JBS)|HRL - Price to Earnings Ratio|Business Payback Period jmsmucker.com SJM|PPC: P/E Multiple|Campbell Soup - Company Value to Net Income|SFD (Smithfield Foods, Inc.) - P/E Multiple|Market Cap to Earnings Corn Products International INGR|P/E Multiple LW|brf-global.com - Price to Earnings Multiple|Post Holdings - Price to Earnings Ratio|Company Value to Net Income MZTI|BellRing Brands Inc - P/E Multiple|Market Cap to Net Income TR|Flowers Foods, Inc. (FLO) - Price to Earnings Ratio|Market Cap to Earnings Simply Good Foods (SMPL)|Price to Earnings Ratio Nomad Foods|Market Cap to Earnings WK Kellogg Corporation KLG|P/E Multiple JJSF|Utz Brands Corp - Price to Earnings Multiple|P/E Multiple THS (TreeHouse Foods, Inc.)|sunopta.com - Price to Earnings Ratio|JBSS - Price to Earnings Ratio|Company Value to Net Income SENEA (Seneca Foods Corp)|LWAY: P/E Multiple|Mama's Creations Corp (MAMA) - P/E Multiple|Price to Earnings Ratio B&G Foods, Inc.|Price to Earnings Multiple BYND (Beyond Burger)|P/E Multiple HAIN|Price to Earnings Ratio Bridgford Foods Corp. BRID|P/E Multiple WYHG (Wing Yip Food Holdings)|Company Value to Net Income LSF|BRLS - Price to Earnings Ratio|Market Cap to Earnings Farmer Bros. Co.|PFAI (pinnaclefoodinc.com) - Price to Earnings Ratio|Sow Good (SOWG) - P/E Multiple|Price to Earnings Ratio TWG|STKH (Steakholder Foods Corp) - Market Price to Net Income Ratio|Price to Earnings Ratio BSFC (Blue Star Foods)|FREE (wholeearthbrands.com) - Company Value to Net Income|P/E Multiple LANC (Lancaster Colony Corporation)|RGF (The Real Good Food) - Market Cap to Net Income|SNAX - Price to Earnings Ratio|Market Cap to Earnings Sovos Brands Corp