BOF - BranchOut Food, Inc. Market Capitalization-to-Revenue Ratio
Corporate company logo of BranchOut Food Inc (BOF)

BranchOut Food Inc. (BOF) is scaling its healthy snack sales volumes through B2B contracts with US retail, leveraging logistics optimization and FCF. P/S levels on this chart confirm market expectations, where the 2.40 mark serves as a key metric for revenue valuation. Business efficiency is bolstered by the full robotization of processing and packaging lines, which significantly reduces personnel costs.

BranchOut Food Inc. (BOF) - Price-to-Revenue Ratio from 02/21/2024 to 11/13/2026

Analytical breakdowns for BranchOut Food Inc. (BOF)
- stock price and consensus target price:
- market capitalization statistics:
General company analysis:BranchOut Food, Inc. BOF
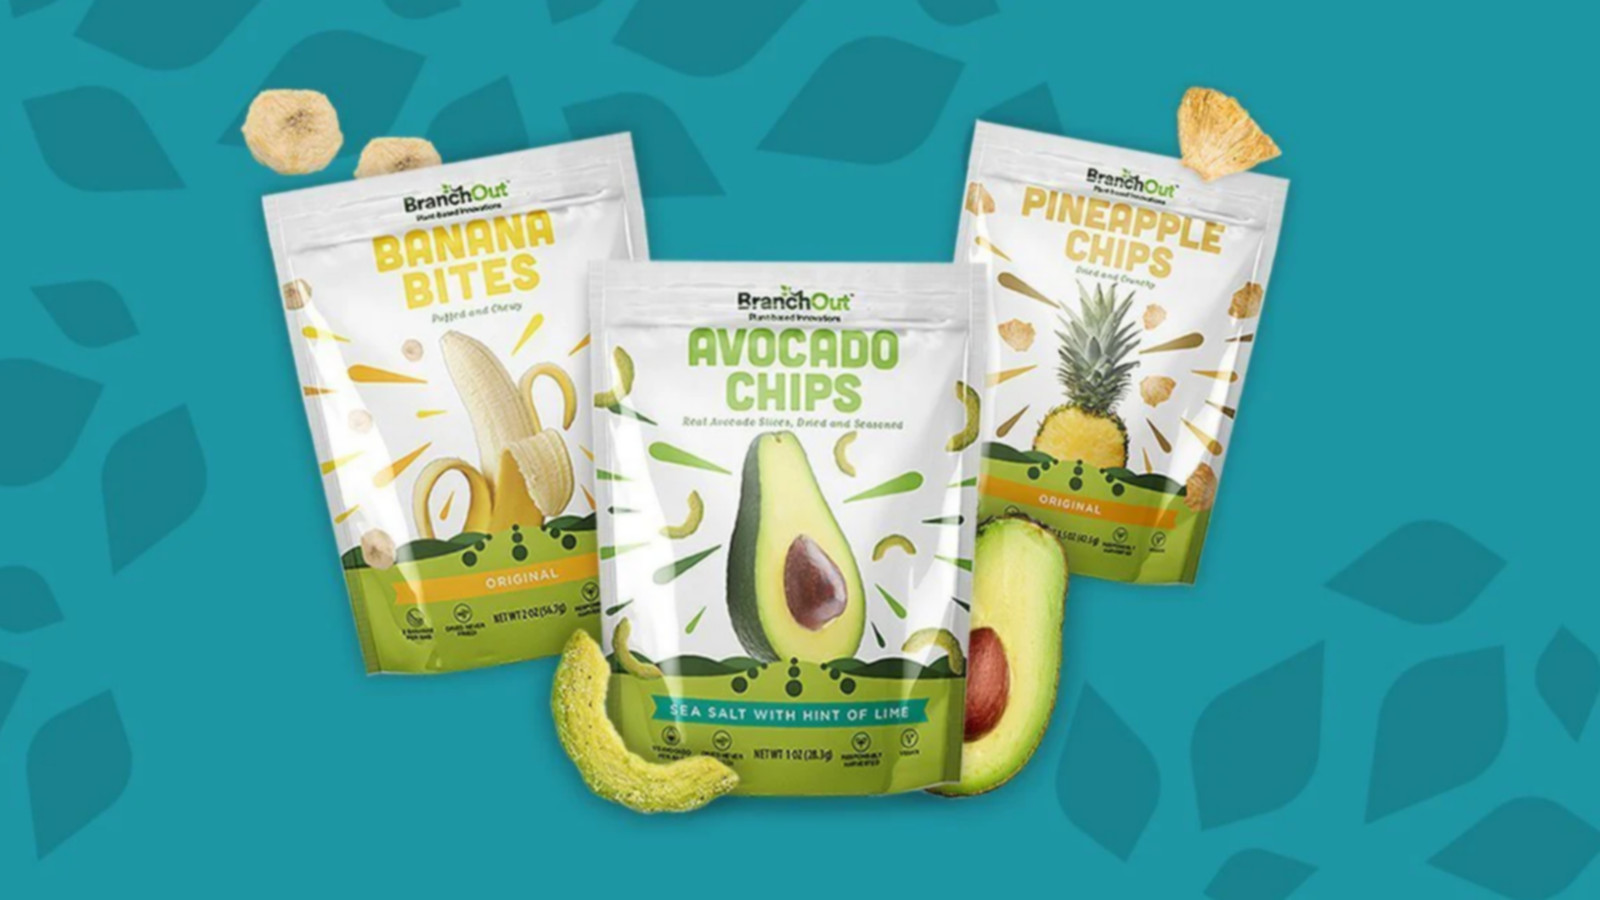
Mass-produced product of BranchOut Food, Inc.

BranchOut Food Inc. is scaling raw material supplies through optimized logistics and cold storage hubs in Central America. Analyzing changes in the price-to-sales ratio allows for an assessment of how effectively the market is capitalizing on these operational achievements. This multiple compares the business's market value with the volume of generated sales, revealing whether the asset is overvalued or undervalued. A decline in this metric amid stable turnover signals an increase in the company's investment attractiveness.

Competitors of BranchOut Food Inc.

kraftheinzcompany.com - Market Cap to Revenue Ratio|Kellogg's - Market Cap to Revenue|Market Capitalization-to-Revenue Ratio GIS|McCormick & Co. - P/S Multiple|Price-to-Sales Ratio JBS|Hormel Foods Corporation (HRL) - Price-to-Revenue Ratio|Price to Sales jmsmucker.com (SJM)|Price-to-Revenue Ratio Pilgrim's Pride Corporation|Price to Sales Campbell Soup CPB|P/S Multiple SFD|Corn Products International - Market Cap to Revenue Ratio|P/S Multiple LW (Lamb Weston Holdings)|brf-global.com - Price-to-Revenue Ratio|POST - Price-to-Revenue Ratio|Market Capitalization-to-Revenue Ratio MZTI (The Marzetti Company)|BRBR: P/S Multiple|Tootsie Roll Corp (TR) - P/S Multiple|Price-to-Revenue Ratio Flowers Foods, Inc.|Market Cap to Revenue Ratio SMPL (The Simply Good Foods)|P/S Multiple NOMD|Market Cap to Revenue WK Kellogg Corporation KLG|P/S Multiple JJSF (J&J Snack Foods Corp.)|Market Capitalization-to-Revenue Ratio UTZ|THS - Price-to-Revenue Ratio|Price to Sales sunopta.com|JBSS (jbssinc.com) - Market Cap to Revenue|Seneca Foods Corp (SENEA) - P/S Multiple|Market Cap to Revenue LWAY|MAMA (Mama's Creations Corp) - Market Cap to Sales Volume|Market Cap to Revenue BGS (B&G Foods, Inc.)|BYND (beyondmeat.com) - Market Capitalization-to-Revenue Ratio|P/S Multiple HAIN (The Hain Celestial Group)|BRID (Bridgford Foods Corp.) - Price-to-Sales Ratio|WYHG - Price-to-Revenue Ratio|Price to Sales lairdsuperfood.com|Borealis Foods (BRLS) - Price-to-Revenue Ratio|Price to Sales Farmer Bros. (FARM)|PFAI (Pinnacle Food Group Inc) - P/S Multiple|Market Cap to Revenue Ratio SOWG (Sow Good, Inc.)|Market Cap to Revenue TWG (Top Wealth Group Holding Ltd)|STKH (Steakholder Foods Corp) - Market Capitalization-to-Revenue Ratio|P/S Multiple BSFC (Blue Star Foods Corp.)|Price-to-Revenue Coefficient Whole Earth Brands Inc. (FREE)|LANC - Price-to-Revenue Ratio|RGF (Real Good Food) - Market Cap to Revenue Ratio|SNAX: P/S Multiple|Market Cap to Revenue Sovos Brands Corp