FARM: Farmer Bros. Co. Market Cap to Revenue Ratio
Corporate company logo of Farmer Bros. Co. (FARM)

Cost optimization and the expansion of direct sales are strengthening the position of Farmer Bros. Co. (FARM) within the HoReCa sector. The price-to-sales ratio exhibits moderate volatility, with the metric currently recorded at 0.10. Stable cash flow is driven by the wholesale distribution of coffee and tea, while a reliable logistics talent pool ensures the resilience of operational processes.

FARM: farmerbros.com P/S Multiple 07/04/2022 - 05/16/2026

Metric breakdowns and analytics for Farmer Bros. Co. (FARM)
- current quotes and average value forecast:
General company analysis:Farmer Bros Co (FARM)
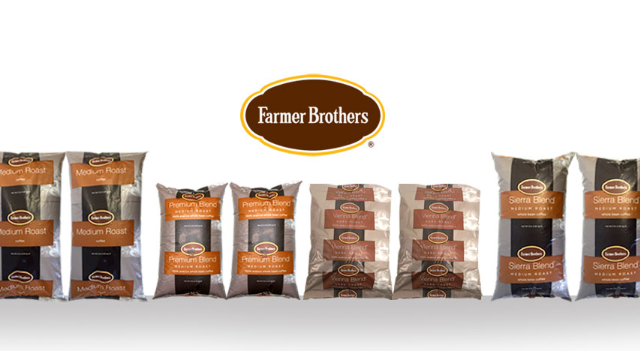
Mass-produced product of Farmer Brothers

The P/S multiple determines the market value of a business relative to its annual turnover, revealing the extent of an asset's overvaluation. By analyzing the price-to-sales ratio, an investor sees the current level of 0.10, reflecting the ratio of market capitalization to revenue. This metric allows for an assessment of sales generation efficiency without accounting for volatile earnings. For Farmer Bros. Co. (FARM), this indicator is critical due to the dependence of revenues on HoReCa traffic and fluctuations in coffee raw material prices.

Competing companies

KHC - Price to Sales|P/S Multiple K (Kellogg's)|GIS: Market Cap to Revenue Ratio|MKC: Market Cap to Revenue|Market Capitalization-to-Revenue Ratio JBS (JBS N.V.)|HRL: P/S Multiple|Price-to-Sales Ratio SJM (jmsmucker.com)|Price-to-Revenue Ratio Pilgrim's Pride Corporation|Price to Sales Campbell Soup CPB|Price-to-Revenue Ratio Smithfield Foods, Inc. (SFD)|INGR - Price to Sales|P/S Multiple LW (Lamb Weston Holdings)|BRFS: Market Cap to Revenue Ratio|Post Holdings - P/S Multiple|Price-to-Sales Ratio MZTI|BRBR: P/S Multiple|Tootsie Roll Corp (TR) - P/S Multiple|Price-to-Revenue Ratio Flowers Foods, Inc.|SMPL: Market Capitalization-to-Revenue Ratio|Price-to-Revenue Ratio Nomad Foods (NOMD)|Market Cap to Revenue WK Kellogg Corporation KLG|P/S Multiple JJSF (J&J Snack Foods Corp.)|Utz Brands Corp (UTZ) - Price to Sales|THS - Price-to-Revenue Ratio|Market Capitalization-to-Revenue Ratio STKL (sunopta.com)|JBSS (jbssinc.com) - Market Cap to Revenue|Seneca Foods Corp - Market Capitalization-to-Revenue Ratio|LWAY (Lifeway Kefir) - P/S Multiple|Price-to-Revenue Ratio MAMA|Price-to-Revenue Ratio B&G Foods, Inc. (BGS)|BYND (beyondmeat.com) - Market Capitalization-to-Revenue Ratio|Price-to-Revenue Ratio The Hain Celestial Group HAIN|Bridgford Foods Corp. (BRID) - Price to Sales|WYHG - Price-to-Revenue Ratio|Price-to-Revenue Coefficient lairdsuperfood.com LSF|BRLS (Borealis Foods) - Market Cap to Revenue|BOF - Price-to-Revenue Coefficient|Market Cap to Revenue PFAI|SOWG: Market Capitalization-to-Revenue Ratio|P/S Multiple TWG|Market Cap to Revenue Steakholder Foods Corp STKH|Price-to-Revenue Ratio Blue Star Foods Corp. BSFC|Whole Earth Brands Inc. (FREE) - Price to Sales|LANC: Market Cap to Revenue|Price-to-Revenue Coefficient Real Good Food RGF|SNAX: P/S Multiple|Price-to-Sales Ratio SOVO (Sovos Brands Corp)