Whole Earth Brands, Inc. (FREE) - Business Payback Period

Whole Earth Brands, Inc. - graphic logo of issuer FREE

Whole Earth Brands (FREE) is implementing eco-friendly standards in the production of natural sweeteners and reducing plastic usage. This price action chart on GURU.Markets shows that the multiple is -8.60. The business relies on growing interest in healthy eating and the expansion of its retail presence. Scaling is driven by plant capacities that minimize costs across massive production volumes.

Whole Earth Brands, Inc. - FREE P/E Multiple (period 07/04/2022 - 08/10/2024)

Comprehensive metric breakdowns and analytics for wholeearthbrands.com (FREE)
- stock price and consensus target price:
Summary company analysis:FREE (Whole Earth Brands, Inc.)
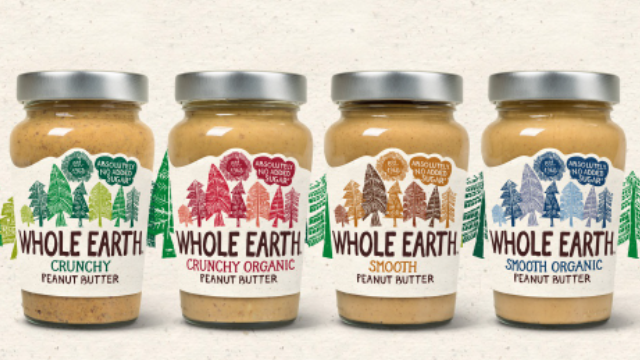
Manufactured product of Whole Earth Brands

The transition of Whole Earth Brands (FREE) to the management of a strategic investor has stabilized the company's market position within the sugar substitute segment. The P/E ratio reflects the cost per unit of profit, allowing for the determination of the premium paid for the asset. By analyzing the P/E ratio dynamics of Whole Earth Brands, an investor assesses the payback period of the investment via net income. This indicator filters inflated market expectations from actual business efficiency. The current valuation confirms the stability of the company's value amid consolidation in the food sector.

Key competitors

Kraft Heinz Company (KHC) - Business Payback Period|Price to Earnings Ratio Kellanova Corp (K)|General Mills Corp - Price to Earnings Multiple|P/E Multiple MKC (mccormickcorporation.com)|Business Payback Period JBS N.V. (JBS)|HRL - Price to Earnings Ratio|Business Payback Period Smucker's SJM|PPC: P/E Multiple|Campbell Soup Co. - Company Value to Net Income|SFD (Smithfield) - P/E Multiple|INGR: Company Value to Net Income|Price to Earnings Ratio LW (Lamb Weston Holdings, Inc.)|BRFS - Market Cap to Earnings|P/E Multiple POST (Post Holdings, Inc.)|MZTI: Price to Earnings Multiple|BRBR: Price to Earnings Ratio|Market Cap to Earnings tootsie.com|Flowers Foods Corp (FLO) - Price to Earnings Ratio|Market Cap to Net Income SMPL (Simply Good Foods Co.)|Price to Earnings Ratio nomadfoods.com|Market Cap to Earnings WK Kellogg Corp KLG|Price to Earnings Ratio J&J Snack Foods Corp (JJSF)|Utz - Price to Earnings Multiple|TreeHouse Foods, Inc. - Price to Earnings Ratio|STKL: Price to Earnings Multiple|JBSS - Price to Earnings Ratio|SENEA (Seneca Foods Company) - Price to Earnings Multiple|LWAY: P/E Multiple|mamascreations.com (MAMA) - P/E Multiple|Price to Earnings Ratio BGS|Market Cap to Earnings beyondmeat.com BYND|Price to Earnings Ratio HAIN (Hain Celestial)|Bridgford Foods Corp - Price to Earnings Multiple|Wing Yip Food - Price to Earnings Ratio|Company Value to Net Income LSF|BRLS - Price to Earnings Ratio|Company Value to Net Income FARM (Farmer Bros Co)|BOF (BranchOut Food) - Price to Earnings Ratio|PFAI (Pinnacle Food Group Inc) - Price to Earnings Ratio|SOWG (Sow Good) - P/E Multiple|TWG (Top Wealth Group Holding) - Market Price to Net Income Ratio|P/E Multiple STKH|BSFC (Blue Star Foods Corporation) - Company Value to Net Income|Lancaster Colony Corp. - Price to Earnings Ratio|Real Good Foods (RGF) - Market Cap to Earnings|Stryve Foods - P/E Multiple|SOVO (sovosbrands.com) - Price to Earnings Multiple