FREE: Whole Earth Brands Market Cap to Revenue Ratio

Corporate company logo of Whole Earth Brands (FREE)

Whole Earth Brands (FREE) business is protected by formulation patents and strict FDA and EFSA oversight. The P/S ratio trend for Whole Earth Brands on the GURU.Markets terminal chart shows that the value of 0.40 expresses the metric level. The Equal and Whole Earth healthy sweetener ecosystem is integrated into global retail, while revenue stability relies on long-term contracts and the cost of plant-based raw materials.

FREE: wholeearthbrands.com P/S Multiple 07/04/2022 - 08/10/2024

Metric breakdowns and analytics for Whole Earth Brands (FREE)
General company analysis:wholeearthbrands.com (FREE)
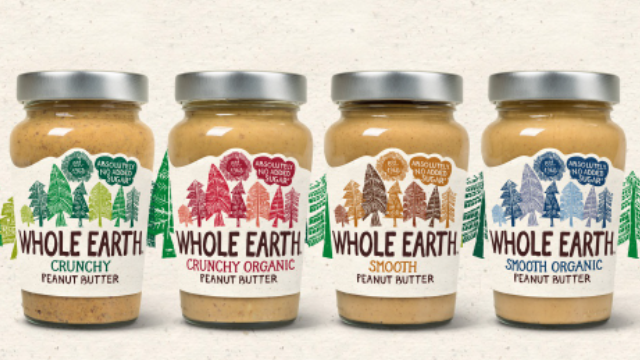
Mass-produced product of Whole Earth

The P/S ratio determines the market value of one dollar of revenue, allowing for an assessment of the asset's overvaluation through the ratio of market capitalization to total income. By analyzing the divergence of the P/S from its historical average, an investor can evaluate the business resilience of Whole Earth Brands (FREE), whose distribution diversification across retail and B2B segments minimizes the risk of sales declines and stabilizes the company's fundamental value.

Who Whole Earth Brands competes with

Kraft Heinz Corp - Market Cap to Revenue Ratio|Price-to-Revenue Ratio kelloggcompany.com K|Market Capitalization-to-Revenue Ratio GIS|McCormick & Co. - P/S Multiple|Price-to-Sales Ratio JBS|Hormel Corp (HRL) - Price-to-Revenue Ratio|Price to Sales J.M. Smucker (SJM)|Price-to-Revenue Ratio pilgrims.com|Price to Sales Campbell Soup Co. CPB|P/S Multiple SFD|INGR - Price to Sales|P/S Multiple LW (lambweston.com)|BRFS: Market Cap to Revenue Ratio|POST - Price-to-Revenue Ratio|T. Marzetti Company - Market Cap to Sales Volume|BRBR: P/S Multiple|TR: Market Cap to Sales Volume|Market Cap to Revenue FLO|Price to Sales The Simply Good Foods Company SMPL|P/S Multiple NOMD|KLG - Price to Sales|Price-to-Revenue Ratio jjsnack.com JJSF|Market Capitalization-to-Revenue Ratio UTZ|THS: Market Cap to Revenue|SunOpta - Market Cap to Sales Volume|JBSS (John B. Sanfilippo & Son) - Market Cap to Revenue|Seneca Foods (SENEA) - P/S Multiple|Market Cap to Revenue LWAY|MAMA: Market Capitalization-to-Revenue Ratio|Market Cap to Revenue BGS (B&G Foods)|BYND - Price to Sales|P/S Multiple HAIN (Hain Celestial Group)|Market Capitalization-to-Revenue Ratio BRID|WYHG - Price-to-Revenue Ratio|Price-to-Sales Ratio LSF|Borealis Foods, Inc. (BRLS) - Price-to-Revenue Ratio|FARM - Price-to-Revenue Coefficient|BOF (BranchOut Food) - P/S Multiple|Market Cap to Revenue Ratio PFAI (Pinnacle Food Group Inc.)|Price-to-Revenue Ratio Sow Good, Inc. (SOWG)|P/S Multiple imperialcristalcaviar.com (TWG)|Price-to-Revenue Ratio Steakholder Foods Corp STKH|Price-to-Revenue Coefficient Blue Star Foods Corporation (BSFC)|LANC: Market Cap to Revenue|Price to Sales The Real Good Food Company Inc.|SNAX (stryve.com) - Market Cap to Revenue|SOVO - Price-to-Revenue Coefficient