Lifeway Kefir (LWAY) - Business Payback Period
Lifeway Foods Inc - graphic logo of issuer LWAY

The historical P/E of Lifeway Foods, Inc. (LWAY) demonstrates the market valuation of Lifeway Foods, Inc. (LWAY), where the value 44.10 represents the most recent figure. This trend confirms the company's status as the absolute favorite in the probiotics segment, capitalizing on the healthy lifestyle trend. Stability is ensured by its control over the functional beverage niche and unique recipes. Effective management by the Smolyansky family sustains demand for the brand's products.

Lifeway Foods - LWAY P/E Multiple (period 07/04/2022 - 11/14/2026)

Comprehensive metric breakdowns and analytics for Lifeway Kefir (LWAY)
- stock price and consensus target price:
Summary company analysis:LWAY (lifewaykefir.com)
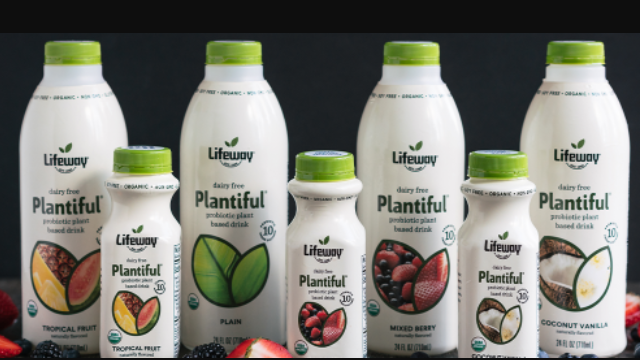
Manufactured product of Lifeway Corp

Lifeway Foods, Inc. (LWAY), as a probiotics market leader with a stable team of technologists, is valued via the market capitalization to net income ratio, which determines the cost of one dollar of earnings. By analyzing the company's average P/E on the GURU.Markets platform, an investor identifies asset overvaluation or growth potential by comparing current quotes with the actual efficiency of the business model to find an entry point.

Key competitors

kraftheinzcompany.com - Market Cap to Net Income|P/E Multiple K|Business Payback Period General Mills Inc|Price to Earnings Ratio McCormick & Co. MKC|JBS: Price to Earnings Multiple|Hormel Foods Corporation - P/E Multiple|Business Payback Period jmsmucker.com SJM|Pilgrim's Pride Corporation (PPC) - Price to Earnings Ratio|CPB - Business Payback Period|SFD (Smithfield Foods, Inc.) - P/E Multiple|INGR: Company Value to Net Income|P/E Multiple LW|BRFS - Market Cap to Earnings|P/E Multiple POST (Post Holdings)|MZTI: Price to Earnings Multiple|BRBR: Price to Earnings Ratio|Company Value to Net Income TR (Tootsie Roll Corp)|FLO: P/E Multiple|Market Cap to Net Income SMPL (Simply Good Foods)|Price to Earnings Ratio Nomad Foods|Market Cap to Earnings WK Kellogg Corporation KLG|Price to Earnings Ratio J&J Snack Foods Corp. (JJSF)|UTZ - Market Cap to Earnings|P/E Multiple THS (TreeHouse Foods, Inc.)|STKL: Price to Earnings Multiple|JBSS - Price to Earnings Ratio|SENEA: Price to Earnings Ratio|MAMA: P/E Multiple|BGS - Business Payback Period|BYND (Beyond Meat Inc) - P/E Multiple|hain.com - Market Cap to Net Income|P/E Multiple BRID|WYHG - Market Cap to Earnings|Laird Superfood, Inc. - Price to Earnings Ratio|BRLS - Price to Earnings Ratio|Farmer Brothers - P/E Multiple|BOF - P/E Multiple|PFAI (pinnaclefoodinc.com) - Price to Earnings Ratio|Market Cap to Earnings Sow Good (SOWG)|Price to Earnings Ratio TWG|STKH: Company Value to Net Income|P/E Multiple BSFC|FREE: Market Cap to Net Income|Price to Earnings Ratio Lancaster Colony Corporation LANC|The Real Good Food (RGF) - Market Cap to Earnings|SNAX - Price to Earnings Ratio|Market Cap to Earnings Sovos Brands Corp