LWAY: Lifeway Corp Market Cap to Revenue Ratio
Corporate company logo of Lifeway Kefir (LWAY)

The median P/S displayed on this chart by GURU.Markets demonstrates the impact of cost inflation on the valuation of Lifeway Foods, Inc. (LWAY), with the current parameter standing at 1.30. Market capitalization is supported by growing demand for immunity-boosting probiotics, although the margins of the kefir business are constrained by a narrow niche and raw material costs. The local US market protects the company from sanctions, but production remains vulnerable to logistics disruptions.

LWAY: Lifeway Corp P/S Multiple 07/04/2022 - 11/13/2026

Metric breakdowns and analytics for Lifeway Kefir (LWAY)
- current quotes and average value forecast:
General company analysis:lifewaykefir.com (LWAY)
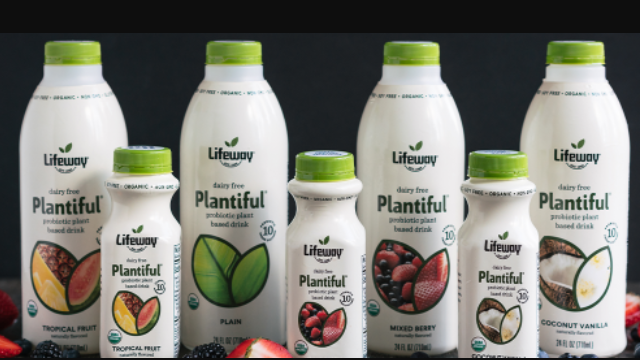
Mass-produced product of Lifeway Foods

Finding a balance between operational risks and return on equity for Lifeway Foods, Inc. (LWAY) requires an analysis of the probiotic brand's expansion into global retail. The P/S time series correlates the business's market value with revenue, allowing investors to assess the premium for future sales growth and determine the company's fundamental stability during a phase of active product line expansion.

Competitors of Lifeway Foods, Inc.

KHC - Price to Sales|P/S Multiple K (Kellogg's)|GIS: Market Cap to Revenue Ratio|MKC: Market Cap to Revenue|Market Capitalization-to-Revenue Ratio JBS (JBS N.V.)|HRL: P/S Multiple|Price-to-Sales Ratio SJM (jmsmucker.com)|Price-to-Revenue Ratio Pilgrim's Pride Corporation|Price to Sales Campbell Soup CPB|Price-to-Revenue Ratio Smithfield Foods, Inc. (SFD)|INGR - Price to Sales|P/S Multiple LW (Lamb Weston Holdings)|BRFS: Market Cap to Revenue Ratio|POST - Price-to-Revenue Ratio|MZTI: Price-to-Revenue Ratio|BRBR: P/S Multiple|TR - Price-to-Revenue Coefficient|FLO (Flowers Foods, Inc.) - P/S Multiple|The Simply Good Foods - Price-to-Sales Ratio|P/S Multiple NOMD|KLG - Price to Sales|J&J Snack Foods Corp. - Market Cap to Revenue|UTZ - Market Cap to Revenue|TreeHouse Foods, Inc. - P/S Multiple|STKL - P/S Multiple|JBSS (jbssinc.com) - Market Cap to Revenue|Price to Sales Seneca Foods Corp (SENEA)|Market Cap to Revenue MAMA|BGS: Market Capitalization-to-Revenue Ratio|P/S Multiple BYND|HAIN: Price-to-Sales Ratio|Price-to-Revenue Ratio Bridgford Foods Corporation BRID|Wing Yip Food Holdings Group (WYHG) - Price to Sales|LSF - Price-to-Revenue Ratio|Price to Sales borealisfoods.ca|FARM: P/S Multiple|Market Cap to Revenue Ratio BOF|Price-to-Revenue Ratio Pinnacle Food Group Inc|Sow Good, Inc. (SOWG) - Price-to-Revenue Coefficient|Market Cap to Revenue TWG (Top Wealth Group Holding Ltd)|STKH (Steakholder Foods Corp) - Market Capitalization-to-Revenue Ratio|P/S Multiple BSFC (Blue Star Foods Corp.)|Price-to-Revenue Coefficient Whole Earth Brands Inc. (FREE)|LANC - Price-to-Revenue Ratio|RGF (Real Good Food) - Market Cap to Revenue Ratio|SNAX: P/S Multiple|Market Cap to Revenue Sovos Brands Corp