RGF - Real Good Food Market Capitalization-to-Revenue Ratio
Corporate company logo of The Real Good Food Company, Inc. (RGF)

The modernization of packaging lines and high plant utilization at The Real Good Food (RGF) confirm capacity growth, and the GURU.Markets system displays this chart of the company's industry-average P/S, where the latest value is recorded as 0.00. The business relies on demand for keto diets and the health and wellness segment, yet faces fierce competition for supermarket shelf space against global behemoths developing similar protein lines.

Real Good Food (RGF) - Price-to-Revenue Ratio from 07/04/2022 to 01/18/2025

Analytical breakdowns for Real Good Food (RGF)
- stock price and consensus target price:
- market capitalization statistics:
Summary company analytics:realgoodfoods.com
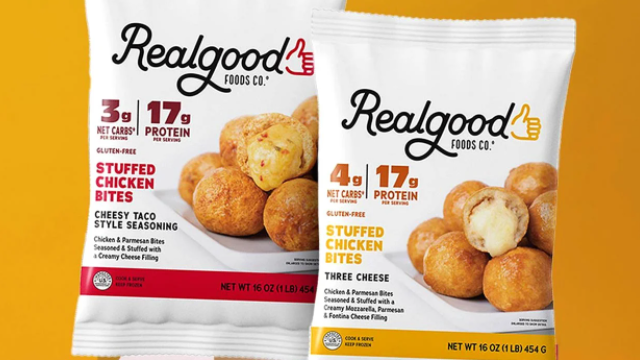
Mass-produced product of realgoodfoods.com

For high-protein product manufacturer The Real Good Food (RGF), the P/S ratio reflects the market value of the business relative to its annual turnover, linking retail expansion rates to capitalization. By analyzing changes in the price-to-sales ratio, an investor assesses how many market dollars are attributed to each unit of sales, which helps determine the degree of asset overvaluation and the sustainability of cash flows during production scaling.

Competing companies

kraftheinzcompany.com - Market Cap to Revenue Ratio|Kellogg's - Market Cap to Revenue|Market Capitalization-to-Revenue Ratio GIS|McCormick & Co. - P/S Multiple|Price-to-Sales Ratio JBS|Hormel Foods Corporation (HRL) - Price-to-Revenue Ratio|Price to Sales jmsmucker.com (SJM)|Price-to-Revenue Ratio Pilgrim's Pride Corporation|Price to Sales Campbell Soup CPB|P/S Multiple SFD|Corn Products International - Market Cap to Revenue Ratio|Lamb Weston Holdings - Market Cap to Revenue|Market Cap to Sales Volume BRFS (brf-global.com)|Post Holdings - P/S Multiple|Market Capitalization-to-Revenue Ratio MZTI (The Marzetti Company)|BRBR: P/S Multiple|Price to Sales Tootsie Roll Corp (TR)|Market Cap to Revenue FLO|SMPL: Market Capitalization-to-Revenue Ratio|Price-to-Revenue Ratio Nomad Foods (NOMD)|KLG (WK Kellogg Corporation) - Market Capitalization-to-Revenue Ratio|P/S Multiple JJSF (J&J Snack Foods Corp.)|Utz Brands Corp (UTZ) - Price to Sales|TreeHouse Foods, Inc. - P/S Multiple|STKL - P/S Multiple|jbssinc.com (JBSS) - Price-to-Revenue Ratio|SENEA (Seneca Foods Corp) - Price-to-Revenue Ratio|Market Cap to Revenue LWAY|MAMA: Market Capitalization-to-Revenue Ratio|P/S Multiple BGS|beyondmeat.com (BYND) - Price-to-Revenue Multiple|Price-to-Revenue Ratio The Hain Celestial Group HAIN|Bridgford Foods Corp. (BRID) - Price to Sales|WYHG - Price-to-Revenue Ratio|Price to Sales lairdsuperfood.com|BRLS: P/S Multiple|Market Cap to Revenue Ratio FARM|Market Cap to Revenue BOF|PFAI: Market Capitalization-to-Revenue Ratio|P/S Multiple SOWG|TWG: Price-to-Sales Ratio|Price-to-Revenue Ratio Steakholder Foods Ltd. STKH|Blue Star Foods Corp (BSFC) - Price to Sales|FREE - Price-to-Revenue Ratio|Price to Sales Lancaster Colony Corp|SNAX: P/S Multiple|Market Cap to Revenue Ratio SOVO