The Real Good Food (RGF) Price to Earnings Multiple
Corporate emblem and logo of The Real Good Food Company Inc. (RGF)

The Real Good Food (RGF) generates revenue by selling low-carb frozen protein products to health-conscious Americans via e-commerce and retail. This price chart, serving as a valuation tool, shows a metric of -0.40, which is critical amid inflationary pressure on raw materials and the struggle for shelf space in retail chains. However, operational disruptions and debt have created an acute liquidity shortage, threatening default or the liquidation of assets.

The Real Good Food Company, Inc. (RGF) Price to Earnings Ratio: for the period 08/22/2022 - 12/31/2024

Comprehensive metric breakdowns and analytics for The Real Good Food (RGF)
- market value and analyst target forecast:
Summary company analysis:The Real Good Food Company RGF
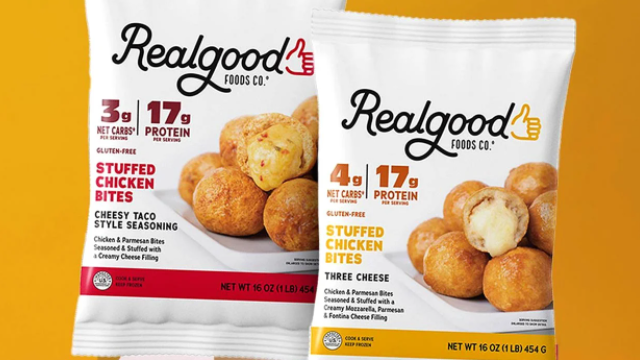
Flagship merchandise of The Real Good Food Company, Inc.

The P/E ratio determines the market value of a business relative to its ability to generate net profit. This metric measures the investment payback period by correlating the current share price with earnings per share. By analyzing P/E valuation trends, an investor identifies whether an asset is overbought or undervalued. For The Real Good Food (RGF), this metric reflects market demand for innovation within the healthy ready-meal sector. Cost management efficiency and brand growth directly determine the issuer's investment attractiveness.

Competing companies

kraftheinzcompany.com (KHC) - Business Payback Period|Price to Earnings Ratio Kellogg's (K)|General Mills Inc - Price to Earnings Multiple|P/E Multiple MKC (McCormick & Co.)|Business Payback Period JBS USA (JBS)|HRL - Price to Earnings Ratio|Business Payback Period jmsmucker.com SJM|PPC: P/E Multiple|Campbell Soup - Company Value to Net Income|SFD (Smithfield Foods, Inc.) - P/E Multiple|Market Cap to Earnings Corn Products International INGR|P/E Multiple LW|brf-global.com - Price to Earnings Multiple|Post Holdings - Price to Earnings Ratio|Company Value to Net Income MZTI|BellRing Brands Inc - P/E Multiple|Market Cap to Net Income TR|Flowers Foods, Inc. (FLO) - Price to Earnings Ratio|Market Cap to Earnings Simply Good Foods (SMPL)|Price to Earnings Ratio Nomad Foods|Market Cap to Earnings WK Kellogg Corporation KLG|P/E Multiple JJSF|Utz Brands Corp - Price to Earnings Multiple|TreeHouse Foods, Inc. - Price to Earnings Ratio|Market Price to Net Income Ratio STKL (sunopta.com)|Sanfilippo - P/E Multiple|Company Value to Net Income SENEA (Seneca Foods Corp)|LWAY: P/E Multiple|Market Cap to Earnings Mama's Creations Corp (MAMA)|Price to Earnings Ratio BGS|BYND: Company Value to Net Income|Price to Earnings Ratio The Hain Celestial Group (HAIN)|BRID (Bridgford Foods Corp.) - Company Value to Net Income|P/E Multiple WYHG (Wing Yip Food Holdings)|lairdsuperfood.com (LSF) - Market Cap to Earnings|Borealis Foods - P/E Multiple|FARM - P/E Multiple|branchoutfood.com (BOF) - Price to Earnings Ratio|PFAI (Pinnacle Food Group Inc.) - Price to Earnings Ratio|Price to Earnings Ratio SOWG|TWG: Company Value to Net Income|P/E Multiple STKH|bluestarfoods.com (BSFC) - Market Cap to Net Income Ratio|Price to Earnings Ratio Whole Earth Brands, Inc. FREE|Lancaster Colony Corp (LANC) - Market Cap to Earnings|SNAX - Price to Earnings Ratio|Market Cap to Earnings Sovos Brands Corp