Utz Brands (UTZ) Price to Earnings Multiple
Corporate emblem and logo of Utz Brands (UTZ)

The weighted average P/E of Utz Brands, Inc. (UTZ) reflects market expectations, where -33.30 indicates the level of this metric. This valuation relies on the brand's long-standing authority and customer trust. A cohesive team and a family-style management approach support the stability of the share price. However, expansion into the salty snacks segment requires significant promotional expenditures amid fierce competition with industry behemoths.

Utz (UTZ) Price to Earnings Ratio: for the period 07/04/2022 - 11/12/2026
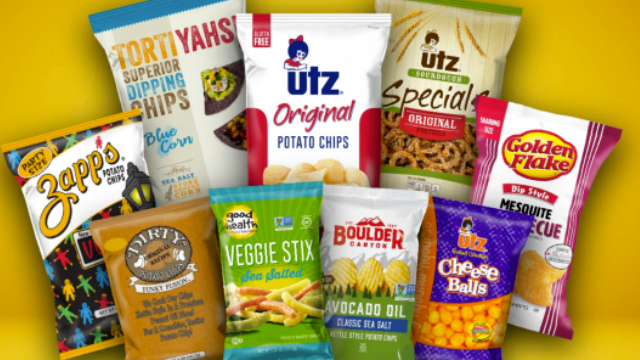
Flagship merchandise of Utz

The P/E ratio reflects the market value of a single unit of net income, demonstrating the capitalization's sensitivity to changes in actual reported earnings. The P/E valuation profile of Utz Brands, Inc. (UTZ) allows for an assessment of market expectations regarding the effectiveness of the company's transition toward margin and logistics optimization, capturing a revaluation of the business's ability to generate a stable cash flow while scaling its national reach.

Competing companies

kraftheinzcompany.com (KHC) - Business Payback Period|Price to Earnings Ratio Kellogg's (K)|General Mills Inc - Price to Earnings Multiple|P/E Multiple MKC (McCormick & Co.)|Business Payback Period JBS USA (JBS)|HRL - Price to Earnings Ratio|Business Payback Period jmsmucker.com SJM|PPC: P/E Multiple|Campbell Soup - Company Value to Net Income|SFD (Smithfield Foods, Inc.) - P/E Multiple|Market Cap to Earnings Corn Products International INGR|P/E Multiple LW|brf-global.com - Price to Earnings Multiple|Post Holdings - Price to Earnings Ratio|Company Value to Net Income MZTI|BellRing Brands Inc - P/E Multiple|Market Cap to Net Income TR|Flowers Foods, Inc. (FLO) - Price to Earnings Ratio|Market Cap to Earnings Simply Good Foods (SMPL)|Price to Earnings Ratio Nomad Foods|Market Cap to Earnings WK Kellogg Corporation KLG|P/E Multiple JJSF|TreeHouse Foods Inc. - Price to Earnings Multiple|SunOpta Inc. - Price to Earnings Ratio|P/E Multiple Fisher Nuts JBSS|SENEA: Price to Earnings Ratio|Lifeway Foods Inc - Market Price to Net Income Ratio|MAMA (MamaMancini's) - Price to Earnings Ratio|Market Cap to Net Income BGS (B&G Foods Holding)|Price to Earnings Ratio BYND|HAIN: Company Value to Net Income|P/E Multiple BRID|Price to Earnings Ratio WYHG (wingyip-food.com)|Price to Earnings Ratio Laird Superfood, Inc. LSF|Company Value to Net Income BRLS|Farmer Brothers - P/E Multiple|BOF - P/E Multiple|pinnaclefoodinc.com (PFAI) - Price to Earnings Ratio|Price to Earnings Multiple SOWG|TWG (Top Wealth Group Holding Ltd) - P/E Multiple|Price to Earnings Multiple STKH (Steakholder Foods Corp)|Price to Earnings Ratio Blue Star Foods (BSFC)|Business Payback Period wholeearthbrands.com|Lancaster Colony Corporation - Price to Earnings Ratio|Company Value to Net Income RGF|Stryve - P/E Multiple|Business Payback Period Sovos Brands Corp SOVO