Borealis Foods (BRLS) - Business Payback Period
Borealis Foods, Inc. - graphic logo of issuer BRLS

This chart illustrating the price evolution of Borealis Foods Inc. (BRLS) demonstrates a P/E ratio of -1.10. Management aims to transform the enterprise into a global healthy nutrition leader through technological innovation. Revenue is generated by the sale of Chef Woo protein noodles in Costco and Walmart, while the company implements biodegradable packaging and minimizes water consumption in the production of plant-based ramen.

Borealis Foods Inc. - BRLS P/E Multiple (period 02/21/2024 - 11/15/2026)

Comprehensive metric breakdowns and analytics for Borealis Foods Inc. (BRLS)
Summary company analysis:BRLS (Borealis Foods Inc.)
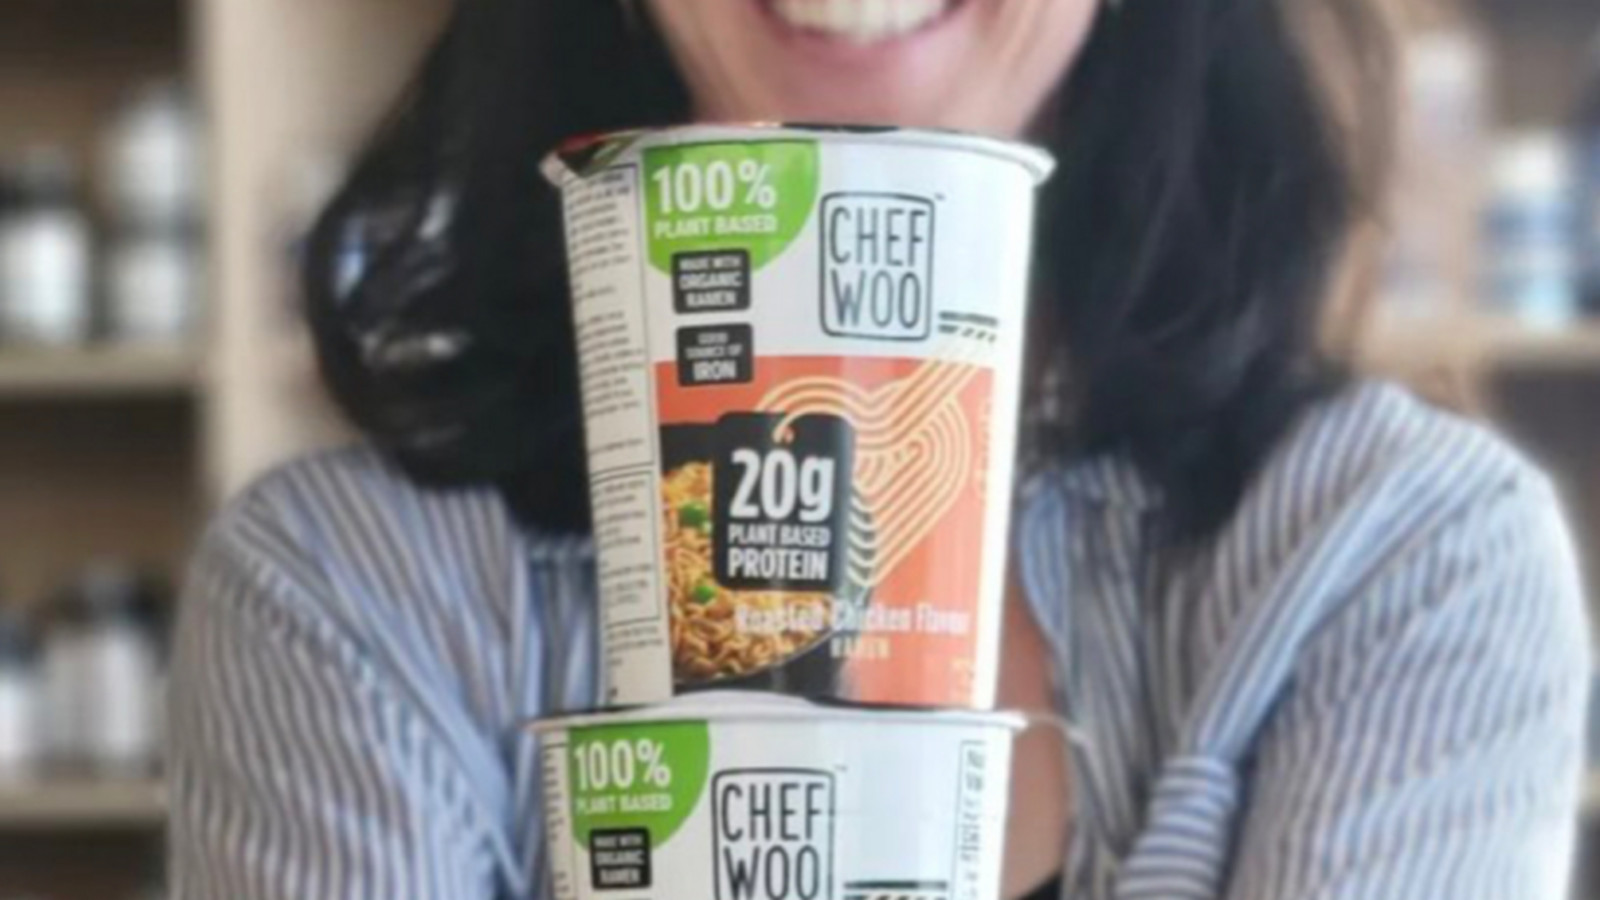
Manufactured product of Borealis Foods, Inc.

The P/E ratio determines the market value of a single unit of net profit, allowing an investor to assess the extent of overpayment for an asset relative to its actual earnings. By analyzing the forward P/E of Borealis Foods Inc. (BRLS), one can identify the risk of overvaluation against a backdrop of falling margins caused by the logistics crisis and raw material shortages in Eastern Europe, which critically impact the business's fundamental value.

Key competitors

Kraft Heinz Company (KHC) - Business Payback Period|Price to Earnings Ratio Kellanova Corp (K)|General Mills Corp - Price to Earnings Multiple|P/E Multiple MKC (mccormickcorporation.com)|Business Payback Period JBS N.V. (JBS)|HRL - Price to Earnings Ratio|Business Payback Period Smucker's SJM|PPC: P/E Multiple|Campbell Soup Co. - Company Value to Net Income|SFD (Smithfield) - P/E Multiple|INGR: Company Value to Net Income|Price to Earnings Ratio LW (Lamb Weston Holdings, Inc.)|BRFS - Market Cap to Earnings|P/E Multiple POST (Post Holdings, Inc.)|MZTI: Price to Earnings Multiple|BRBR: Price to Earnings Ratio|Market Cap to Earnings tootsie.com|Flowers Foods Corp (FLO) - Price to Earnings Ratio|Market Cap to Net Income SMPL (Simply Good Foods Co.)|Price to Earnings Ratio nomadfoods.com|Market Cap to Earnings WK Kellogg Corp KLG|Price to Earnings Ratio J&J Snack Foods Corp (JJSF)|Utz - Price to Earnings Multiple|TreeHouse Foods, Inc. - Price to Earnings Ratio|STKL: Price to Earnings Multiple|JBSS - Price to Earnings Ratio|SENEA (Seneca Foods Company) - Price to Earnings Multiple|LWAY: P/E Multiple|mamascreations.com (MAMA) - P/E Multiple|Price to Earnings Ratio BGS|Market Cap to Earnings beyondmeat.com BYND|Price to Earnings Ratio HAIN (Hain Celestial)|Bridgford Foods Corp - Price to Earnings Multiple|Wing Yip Food - Price to Earnings Ratio|Company Value to Net Income LSF|FARM - Price to Earnings Ratio|Market Cap to Earnings BranchOut Food, Inc.|Pinnacle Food Group Inc (PFAI) - Price to Earnings Ratio|Market Cap to Earnings Sow Good Inc (SOWG)|Price to Earnings Ratio TWG|Price to Earnings Ratio STKH|Price to Earnings Ratio Blue Star Foods Corp (BSFC)|FREE (Whole Earth) - Company Value to Net Income|Lancaster Colony Corp. - Price to Earnings Ratio|Real Good Foods (RGF) - Market Cap to Earnings|Stryve Foods - P/E Multiple|SOVO (sovosbrands.com) - Price to Earnings Multiple