Hormel (HRL) Price to Earnings Multiple
Corporate emblem and logo of Hormel (HRL)

Hormel Foods Corporation (HRL) is striving for global leadership through the acquisition of assets in the health and wellness and snacks segments. The change in the company's P/E multiple visualizes the current valuation, where the value 35.60 captures this metric. The countercyclical nature of the business ensures demand stability during crises, although raw material inflation and the expansion of retailer private labels create certain pressure on the brand's market positions.

Hormel Foods (HRL) Price to Earnings Ratio: for the period 07/04/2022 - 11/18/2026

Comprehensive metric breakdowns and analytics for Hormel (HRL)
- market value and analyst target forecast:
Summary company analysis:Hormel Foods Corp HRL
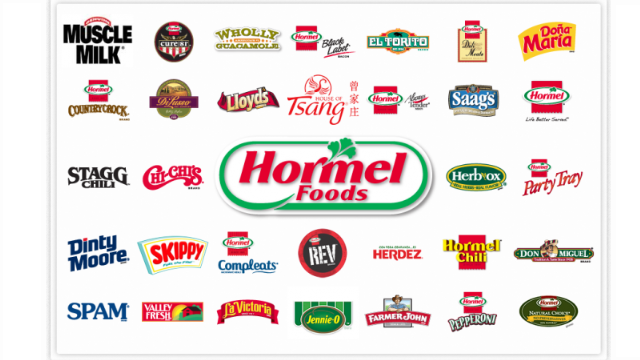
Flagship merchandise of Hormel Foods

To build a resilient portfolio, I use this ratio as a filter for asset overvaluation. The metric is calculated by dividing the share price by earnings per share, measuring the investment's payback period. For Hormel Foods Corporation (HRL), whose revenues are based on mass demand for SPAM and SKIPPY, this calculation confirms the stability of cash flows. By analyzing the company's average P/E, an investor can distinguish the business's fundamental value from market speculation.

Competing companies

Kraft Heinz Company (KHC) - Business Payback Period|Price to Earnings Ratio Kellanova Corp (K)|General Mills Corp - Price to Earnings Multiple|P/E Multiple MKC (mccormickcorporation.com)|Business Payback Period JBS N.V. (JBS)|SJM - Price to Earnings Ratio|Business Payback Period Pilgrim's Pride Corporation PPC|CPB: P/E Multiple|Smithfield Foods, Inc. - Company Value to Net Income|INGR (Ingredion Incorporated) - P/E Multiple|Price to Earnings Multiple LW (Lamb Weston Holdings Inc)|P/E Multiple BRFS|POST - Market Cap to Earnings|P/E Multiple MZTI (The Marzetti Co)|BRBR: Price to Earnings Multiple|TR - Price to Earnings Ratio|Market Cap to Net Income FLO|SMPL: P/E Multiple|Market Cap to Net Income NOMD (Nomad Foods Ltd)|Price to Earnings Ratio wkkellogg.com|Market Cap to Earnings J&J Snack Foods Inc JJSF|P/E Multiple UTZ|TreeHouse Foods - Price to Earnings Multiple|P/E Multiple STKL (SunOpta Corp)|JBSS: Price to Earnings Multiple|Seneca Foods - P/E Multiple|LWAY: Price to Earnings Ratio|MAMA: P/E Multiple|Market Cap to Net Income Ratio B&G Foods BGS|Price to Earnings Ratio BYND|Market Cap to Earnings Hain Celestial HAIN|P/E Multiple BRID|Wing Yip Food Group (WYHG) - Market Cap to Net Income Ratio|Laird Superfood, Inc. - Price to Earnings Ratio|P/E Multiple Borealis Foods, Inc. BRLS|FARM - Price to Earnings Ratio|Market Cap to Earnings BranchOut Food, Inc.|Pinnacle Food Group Inc (PFAI) - Price to Earnings Ratio|Market Cap to Earnings Sow Good Inc (SOWG)|Price to Earnings Ratio TWG|Price to Earnings Ratio STKH|Price to Earnings Ratio Blue Star Foods Corp (BSFC)|FREE (Whole Earth) - Company Value to Net Income|Lancaster Colony Corp. - Price to Earnings Ratio|Real Good Foods (RGF) - Market Cap to Earnings|Stryve Foods - P/E Multiple|SOVO (sovosbrands.com) - Price to Earnings Multiple