Pilgrim's (PPC) Price to Earnings Multiple
Corporate emblem and logo of Pilgrim's (PPC)

The extensive infrastructure of poultry farms and hubs ensures supply stability, which is reflected in the expected P/E of Pilgrim's Pride (PPC), as shown on this GURU.Markets chart where 21.70 becomes the new value for the indicator. This occurs against a backdrop of low margins due to dependence on feed and retail prices, while maintaining a high level of professionalism within the management core and logistics specialists.

Pilgrim's Pride Corporation (PPC) Price to Earnings Ratio: for the period 07/04/2022 - 11/10/2026

Comprehensive metric breakdowns and analytics for Pilgrim's Corp (PPC)
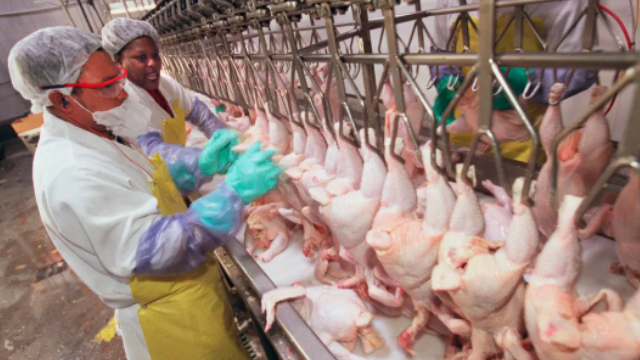
- market value and analyst target forecast:
Summary company analysis:pilgrims.com PPC
Flagship merchandise of Pilgrim's Pride Corporation

The stability of Pilgrim's Pride (PPC) relies on its poultry production scale amid a heavy dependence on feed prices and retail. The P/E ratio reflects the business value relative to its net income, measuring the investment payback period at current earnings levels. The analyst compares this multiple with the low margins of a commoditized product to avoid purchasing a stagnating asset. The expected P/E of Pilgrim's Pride (PPC) helps determine the balance between capital preservation and real growth.

Competing companies

kraftheinzcompany.com (KHC) - Business Payback Period|Price to Earnings Ratio Kellogg's (K)|General Mills Inc - Price to Earnings Multiple|P/E Multiple MKC (McCormick & Co.)|Business Payback Period JBS USA (JBS)|HRL - Price to Earnings Ratio|Business Payback Period jmsmucker.com SJM|CPB: P/E Multiple|Smithfield - Company Value to Net Income|INGR (Ingredion Corp) - P/E Multiple|Market Cap to Earnings lambweston.com LW|P/E Multiple BRFS|postholdings.com - Price to Earnings Multiple|T. Marzetti - Price to Earnings Ratio|Company Value to Net Income BRBR|Tootsie Roll Industries Inc - P/E Multiple|Market Cap to Net Income FLO|thesimplygoodfoodscompany.com (SMPL) - Price to Earnings Ratio|Market Cap to Earnings nomadfoods.com (NOMD)|Price to Earnings Ratio WK Kellogg|Market Cap to Earnings J&J Snack Foods Corp JJSF|P/E Multiple UTZ|TreeHouse Foods Inc. - Price to Earnings Multiple|Price to Earnings Ratio SunOpta Inc. STKL|JBSS (Fisher Nuts) - Market Cap to Net Income|Seneca Foods Corporation - P/E Multiple|Business Payback Period Lifeway Foods Inc LWAY|MamaMancini's (MAMA) - Price to Earnings Ratio|BGS (B&G Foods Holding) - Price to Earnings Ratio|BYND (Beyond Meat Inc) - P/E Multiple|HAIN - Market Cap to Net Income Ratio|Price to Earnings Ratio Bridgford Foods Corporation (BRID)|WYHG (wingyip-food.com) - Company Value to Net Income|P/E Multiple LSF (Laird Superfood, Inc.)|Business Payback Period borealisfoods.ca (BRLS)|FARM - Price to Earnings Ratio|BranchOut Food Inc. (BOF) - Price to Earnings Ratio|pinnaclefoodinc.com (PFAI) - Price to Earnings Ratio|SOWG - Business Payback Period|Price to Earnings Ratio TWG|STKH: Company Value to Net Income|Price to Earnings Ratio Blue Star Foods (BSFC)|FREE: Market Cap to Net Income|Price to Earnings Ratio Lancaster Colony Corporation LANC|Company Value to Net Income RGF|Stryve - P/E Multiple|Business Payback Period Sovos Brands Corp SOVO