MamaMancini's (MAMA) - Business Payback Period
Mama's Creations Inc - graphic logo of issuer MAMA

The price action of Mama's Creations, Inc. (MAMA) securities, whose business is based on the production of semi-finished products, demonstrates the 88.80 indicator. Mama's Creations, Inc. (MAMA) is actively hiring B2B experts despite turnover among line workers, while retaining key technologists. Raw material costs and strict hygiene regulations limit profitability. At the same time, management is effectively scaling distribution through retail and has successfully refreshed the brand image.

Mama's Creations - MAMA P/E Multiple (period 02/21/2024 - 11/12/2026)

Comprehensive metric breakdowns and analytics for MamaMancini's (MAMA)
- stock price and consensus target price:
Summary company analysis:MAMA (mamascreations.com)
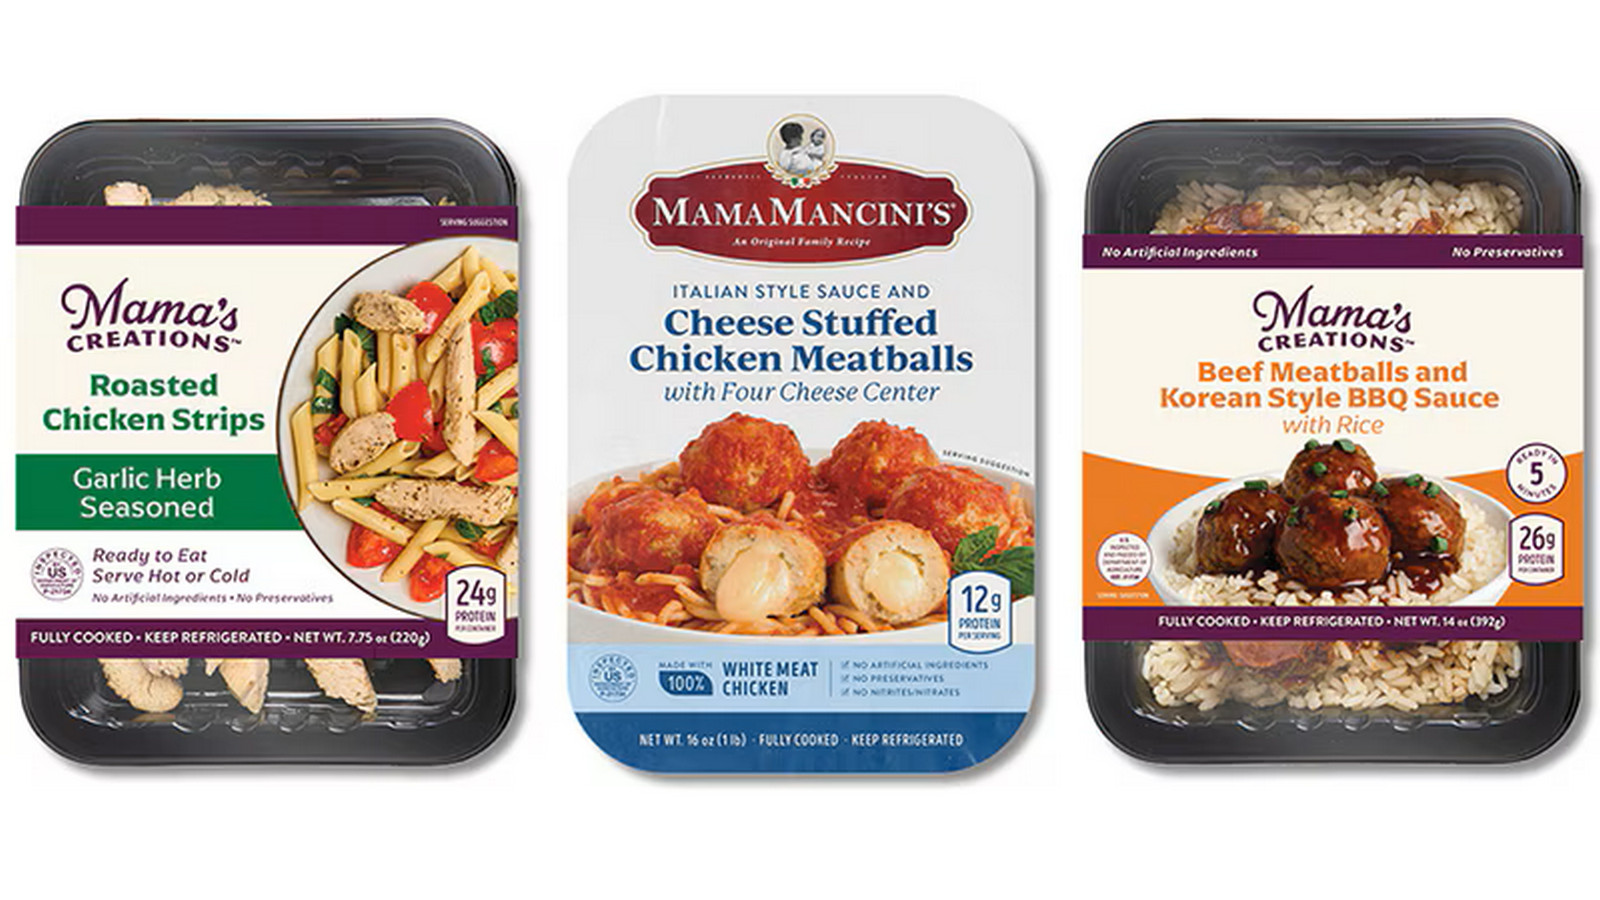
Manufactured product of Mama's Creations Corp

The P/E ratio determines the market value of one dollar of earnings by comparing the current share price to the company's net income. Daily calculation of this metric filters out market noise, allowing for an assessment of the business's real value beyond short-term volatility. By analyzing the P/E ratio, an investor identifies the degree to which an asset is overvalued relative to its operational efficiency. For Mama's Creations, Inc. (MAMA), this price action reflects market confidence in its expansion strategy for ready-to-eat meals through retail chains.

Key competitors

kraftheinzcompany.com - Market Cap to Net Income|P/E Multiple K|Business Payback Period General Mills Inc|Price to Earnings Ratio McCormick & Co. MKC|JBS: Price to Earnings Multiple|Hormel Foods Corporation - P/E Multiple|Business Payback Period jmsmucker.com SJM|Pilgrim's Pride Corporation (PPC) - Price to Earnings Ratio|CPB - Business Payback Period|SFD (Smithfield Foods, Inc.) - P/E Multiple|INGR: Company Value to Net Income|P/E Multiple LW|BRFS - Market Cap to Earnings|P/E Multiple POST (Post Holdings)|MZTI: Price to Earnings Multiple|BRBR: Price to Earnings Ratio|Company Value to Net Income TR (Tootsie Roll Corp)|FLO: P/E Multiple|Market Cap to Net Income SMPL (Simply Good Foods)|Price to Earnings Ratio Nomad Foods|Market Cap to Earnings WK Kellogg Corporation KLG|Price to Earnings Ratio J&J Snack Foods Corp. (JJSF)|UTZ - Market Cap to Earnings|P/E Multiple THS (TreeHouse Foods, Inc.)|STKL: Price to Earnings Multiple|JBSS - Price to Earnings Ratio|Seneca Foods Corp (SENEA) - Price to Earnings Ratio|LWAY: P/E Multiple|B&G Foods Holding (BGS) - P/E Multiple|Price to Earnings Ratio Beyond Meat Inc|Price to Earnings Ratio hain.com (HAIN)|P/E Multiple BRID|P/E Multiple wingyip-food.com (WYHG)|Price to Earnings Ratio Laird Superfood, Inc. LSF|Business Payback Period borealisfoods.ca (BRLS)|FARM: Price to Earnings Ratio|Company Value to Net Income BOF (BranchOut Food Inc.)|PFAI: P/E Multiple|Price to Earnings Ratio Sow Good|Price to Earnings Ratio Top Wealth Group Holding Ltd|STKH: Company Value to Net Income|P/E Multiple BSFC|FREE - Market Cap to Earnings|P/E Multiple LANC (Lancaster Colony Corporation)|P/E Multiple The Real Good Food RGF|SNAX: Price to Earnings Ratio|Sovos Brands Corp - Market Price to Net Income Ratio