Smithfield (SFD) Price to Earnings Multiple
Corporate emblem and logo of Smithfield (SFD)

The base P/E of Smithfield Foods Inc (SFD) confirms the company's status as a reliable link in global supply chains. However, raw material volatility and inflation are hindering growth, while the fight against methane emissions requires significant expenditure. This chart's current trend demonstrates these challenges, with the 8.40 mark capturing this metric, linking market value to the business's actual operating profit.

Smithfield Foods (SFD) Price to Earnings Ratio: for the period 01/29/2025 - 11/14/2026

Comprehensive metric breakdowns and analytics for Smithfield Foods, Inc. (SFD)
- market value and analyst target forecast:
Summary company analysis:smithfieldfoods.com SFD
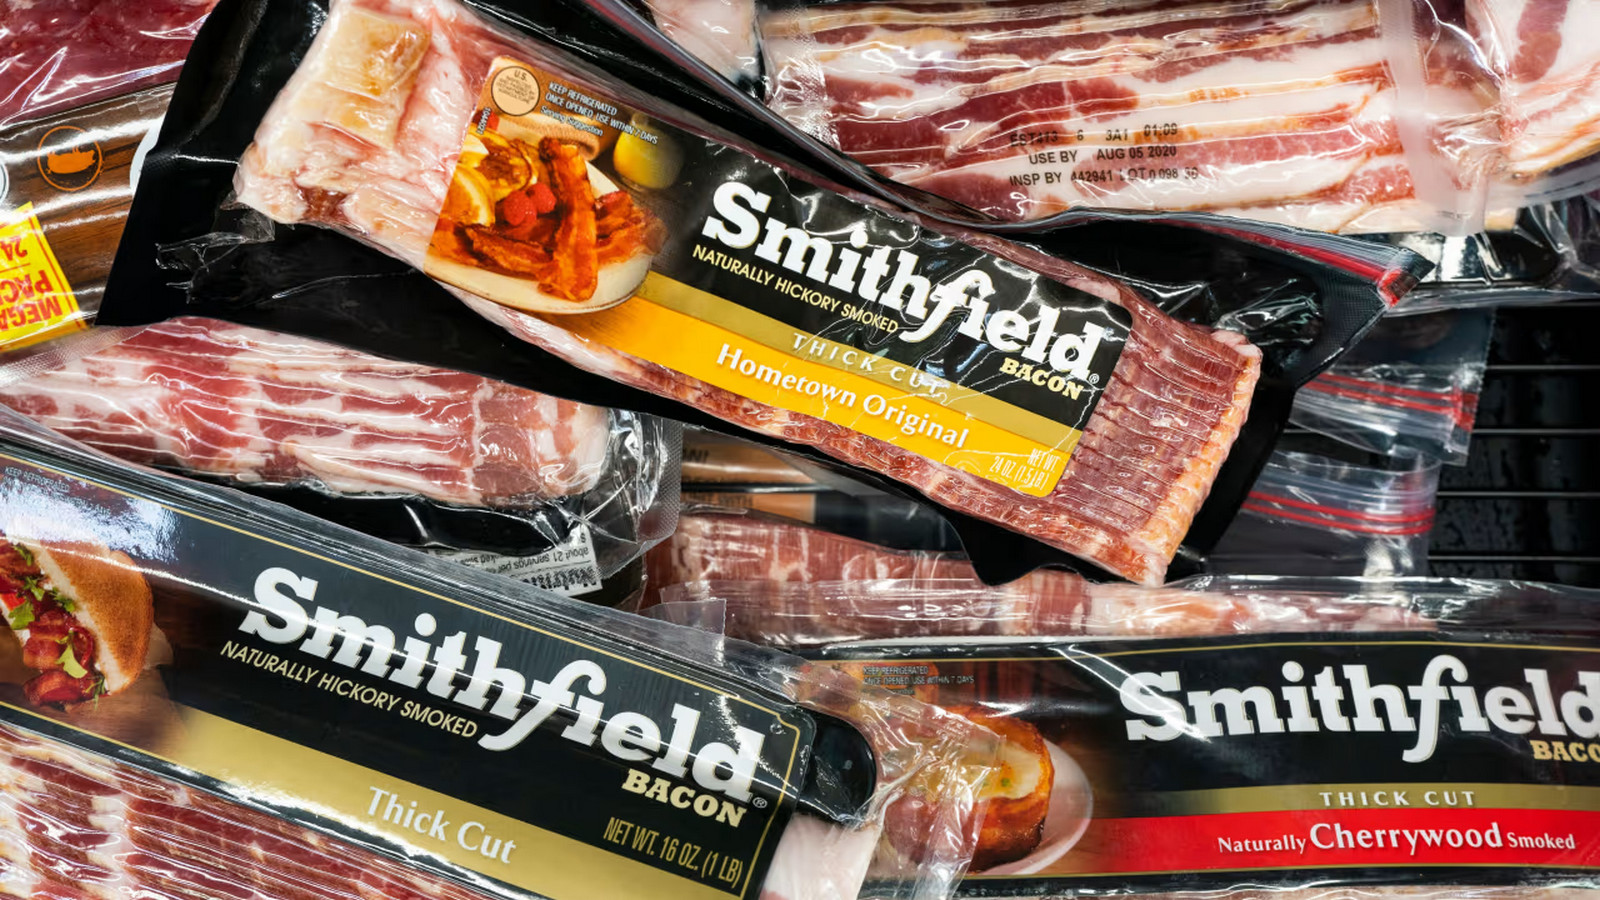
Flagship merchandise of Smithfield Foods

The scale of Smithfield Foods Inc (SFD) as a global leader in pork production makes the company's rolling P/E a key tool for assessing capital efficiency. This ratio compares the market value of the share with net income, determining the investment payback period and the risk of a "value trap." The calculation is based on the ratio of the current price to EPS, reflecting the market's revaluation of fundamental returns. Stable FCF and vertical business integration allow investors to use this indicator to verify margin sustainability.

Competing companies

kraftheinzcompany.com (KHC) - Business Payback Period|Price to Earnings Ratio Kellogg's (K)|General Mills Inc - Price to Earnings Multiple|P/E Multiple MKC (McCormick & Co.)|Business Payback Period JBS USA (JBS)|HRL - Price to Earnings Ratio|Business Payback Period jmsmucker.com SJM|PPC: P/E Multiple|Campbell Soup - Company Value to Net Income|INGR (Ingredion Corp) - P/E Multiple|Market Cap to Earnings lambweston.com LW|P/E Multiple BRFS|postholdings.com - Price to Earnings Multiple|T. Marzetti - Price to Earnings Ratio|Company Value to Net Income BRBR|Tootsie Roll Industries Inc - P/E Multiple|Market Cap to Net Income FLO|thesimplygoodfoodscompany.com (SMPL) - Price to Earnings Ratio|Market Cap to Earnings nomadfoods.com (NOMD)|Price to Earnings Ratio WK Kellogg|Market Cap to Earnings J&J Snack Foods Corp JJSF|P/E Multiple UTZ|TreeHouse Foods Inc. - Price to Earnings Multiple|Price to Earnings Ratio SunOpta Inc. STKL|Business Payback Period Fisher Nuts (JBSS)|SENEA - Price to Earnings Ratio|Lifeway Foods Inc (LWAY) - Price to Earnings Ratio|MAMA: P/E Multiple|BGS - Business Payback Period|Price to Earnings Ratio BYND|HAIN (hain.com) - Market Price to Net Income Ratio|P/E Multiple BRID|WYHG (wingyip-food.com) - Company Value to Net Income|P/E Multiple LSF (Laird Superfood, Inc.)|BRLS (borealisfoods.ca) - Market Cap to Net Income|Farmer Brothers - P/E Multiple|Business Payback Period BranchOut Food Inc. BOF|PFAI: P/E Multiple|Market Cap to Earnings Sow Good (SOWG)|Price to Earnings Ratio Top Wealth Group Holding Ltd|Price to Earnings Ratio STKH|P/E Multiple BSFC|wholeearthbrands.com - Price to Earnings Multiple|Lancaster Colony Corporation - Price to Earnings Ratio|Company Value to Net Income RGF|Stryve - P/E Multiple|Market Cap to Net Income SOVO