Campbell Soup (CPB) Price to Earnings Multiple
Corporate emblem and logo of Campbell Soup (CPB)

Campbell Soup Company (CPB) conservative management effectively protects margins and refreshes its classic product line. The company's normalized P/E on GURU.Markets captures risk premium dynamics, where the indicator value stands at 17.20. However, delegating raw material sourcing to farmers creates external dependencies, despite the company's status as an iconic brand with global recognition and long-standing consumer trust.

Campbell's (CPB) Price to Earnings Ratio: for the period 07/04/2022 - 11/17/2026

Comprehensive metric breakdowns and analytics for Campbell Soup (CPB)
- market value and analyst target forecast:
Summary company analysis:Campbell Soup Co. CPB
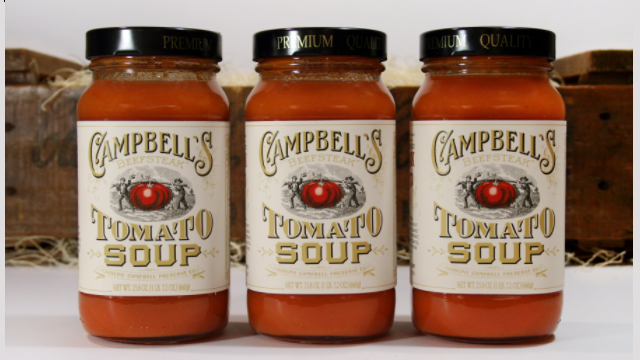
Flagship merchandise of Campbell's

The P/E ratio reflects the market value of Campbell Soup Company (CPB) relative to its net income, determining the asset's investment attractiveness. This coefficient is sensitive to currency fluctuations, which directly impact export revenues and the overall business valuation. By analyzing the price-to-earnings ratio dynamics, an investor gains a real-time assessment of the company's objective value. Stable utilization of automated production lines guarantees revenue predictability, minimizing the risks of an unjustified undervaluation of the multiple.

Competing companies

Kraft Heinz Company (KHC) - Business Payback Period|Price to Earnings Ratio Kellanova Corp (K)|General Mills Corp - Price to Earnings Multiple|P/E Multiple MKC (mccormickcorporation.com)|Business Payback Period JBS N.V. (JBS)|HRL - Price to Earnings Ratio|Business Payback Period Smucker's SJM|PPC: P/E Multiple|Smithfield Foods, Inc. - Company Value to Net Income|INGR (Ingredion Incorporated) - P/E Multiple|Price to Earnings Multiple LW (Lamb Weston Holdings Inc)|P/E Multiple BRFS|POST - Market Cap to Earnings|P/E Multiple MZTI (The Marzetti Co)|BRBR: Price to Earnings Multiple|TR - Price to Earnings Ratio|Market Cap to Net Income FLO|SMPL: P/E Multiple|Market Cap to Net Income NOMD (Nomad Foods Ltd)|Price to Earnings Ratio wkkellogg.com|Market Cap to Earnings J&J Snack Foods Inc JJSF|P/E Multiple UTZ|TreeHouse Foods - Price to Earnings Multiple|P/E Multiple STKL (SunOpta Corp)|JBSS: Price to Earnings Multiple|Seneca Foods - P/E Multiple|LWAY: Price to Earnings Ratio|MAMA: P/E Multiple|Market Cap to Net Income Ratio B&G Foods BGS|Price to Earnings Ratio BYND|Market Cap to Earnings Hain Celestial HAIN|P/E Multiple BRID|Wing Yip Food Group (WYHG) - Market Cap to Net Income Ratio|Laird Superfood, Inc. - Price to Earnings Ratio|P/E Multiple Borealis Foods, Inc. BRLS|FARM - Price to Earnings Ratio|Market Cap to Earnings BranchOut Food, Inc.|Pinnacle Food Group Inc (PFAI) - Price to Earnings Ratio|Market Cap to Earnings Sow Good Inc (SOWG)|Price to Earnings Ratio TWG|Price to Earnings Ratio STKH|Price to Earnings Ratio Blue Star Foods Corp (BSFC)|FREE (Whole Earth) - Company Value to Net Income|Lancaster Colony Corp. - Price to Earnings Ratio|Real Good Foods (RGF) - Market Cap to Earnings|Stryve Foods - P/E Multiple|SOVO (sovosbrands.com) - Price to Earnings Multiple