SunOpta Corp (STKL) - Business Payback Period

SunOpta Inc - graphic logo of issuer STKL

Scaling the B2B segment and plant automation are creating operational leverage, which drives the P/E dynamics for SunOpta Inc. (STKL). The current level of this metric is 49.80. The positive image of SunOpta Inc. in eco-products strengthens loyalty, although dependence on major customers limits pricing power. Analyzing the chart helps identify valuation anomalies and avoid investment traps when assessing the asset.

SunOpta - STKL P/E Multiple (period 07/04/2022 - 05/16/2026)
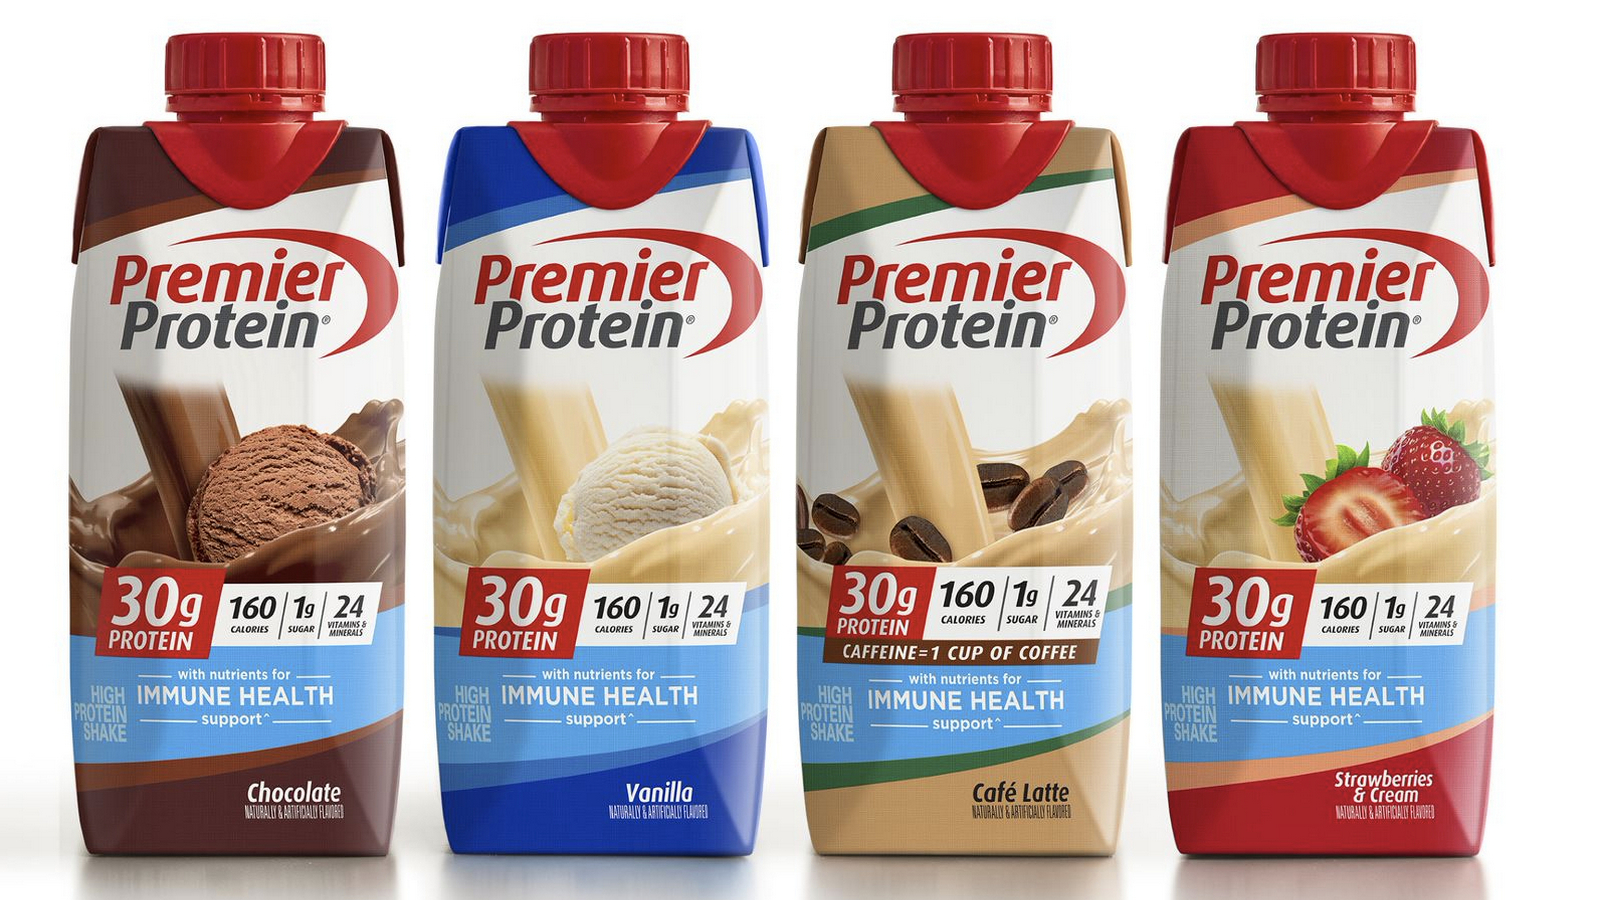
Manufactured product of SunOpta Foods

SunOpta Inc. (STKL) transition to zero-waste production and sustainable development requires significant capital expenditures, which directly impacts net income. The ratio of market capitalization to this profit determines the P/E ratio, measuring the cost of one dollar of earnings and helping to distinguish an undervalued asset from a stagnating business. By analyzing the P/E dynamics of SunOpta Inc. (STKL), an investor can timely recognize a "value trap" and assess the efficiency of the ecological transformation.

Key competitors

kraftheinzcompany.com - Market Cap to Net Income|P/E Multiple K|Business Payback Period General Mills Inc|Price to Earnings Ratio McCormick & Co. MKC|JBS: Price to Earnings Multiple|Hormel Foods Corporation - P/E Multiple|Business Payback Period jmsmucker.com SJM|Pilgrim's Pride Corporation (PPC) - Price to Earnings Ratio|CPB - Business Payback Period|SFD (Smithfield Foods, Inc.) - P/E Multiple|INGR: Company Value to Net Income|P/E Multiple LW|BRFS - Market Cap to Earnings|P/E Multiple POST (Post Holdings)|MZTI: Price to Earnings Multiple|BRBR: Price to Earnings Ratio|Company Value to Net Income TR (Tootsie Roll Corp)|FLO: P/E Multiple|Market Cap to Net Income SMPL (Simply Good Foods)|Price to Earnings Ratio Nomad Foods|Market Cap to Earnings WK Kellogg Corporation KLG|Price to Earnings Ratio J&J Snack Foods Corp. (JJSF)|UTZ - Market Cap to Earnings|P/E Multiple THS (TreeHouse Foods, Inc.)|JBSS: Price to Earnings Multiple|SENEA - Price to Earnings Ratio|Business Payback Period Lifeway Foods Inc LWAY|MAMA (MamaMancini's) - Price to Earnings Ratio|B&G Foods Holding (BGS) - P/E Multiple|Price to Earnings Ratio Beyond Meat Inc|Price to Earnings Multiple HAIN (hain.com)|Price to Earnings Ratio Bridgford Foods Corporation (BRID)|WYHG - Market Cap to Earnings|Price to Earnings Ratio Laird Superfood, Inc. LSF|BRLS (borealisfoods.ca) - Market Cap to Net Income|FARM: Price to Earnings Ratio|BranchOut Food Inc. - Market Price to Net Income Ratio|PFAI: P/E Multiple|Sow Good (SOWG) - P/E Multiple|Price to Earnings Ratio TWG|STKH: Company Value to Net Income|P/E Multiple BSFC|Business Payback Period wholeearthbrands.com|Price to Earnings Ratio Lancaster Colony Corporation LANC|RGF: Price to Earnings Multiple|Stryve - P/E Multiple|Sovos Brands Corp (SOVO) - Price to Earnings Ratio