WK Kellogg Corporation (KLG) Price to Earnings Multiple
Corporate emblem and logo of WK Kellogg Corporation (KLG)

WK Kellogg Co revenue stability is based on a broad line of family breakfasts, which minimizes risks. The company's historical P/E level serves as a filter between real value and market illusions, where the indicator value is 55.40. Market capitalization relies on the mass sale of cereals in North America, and high loyalty to legacy brands makes the asset a predictable but slow instrument.

WK Kellogg (KLG) Price to Earnings Ratio: for the period 08/07/2024 - 10/18/2025

Comprehensive metric breakdowns and analytics for WK Kellogg Corporation (KLG)
- market value and analyst target forecast:
Summary company analysis:WK Kellogg Corp KLG
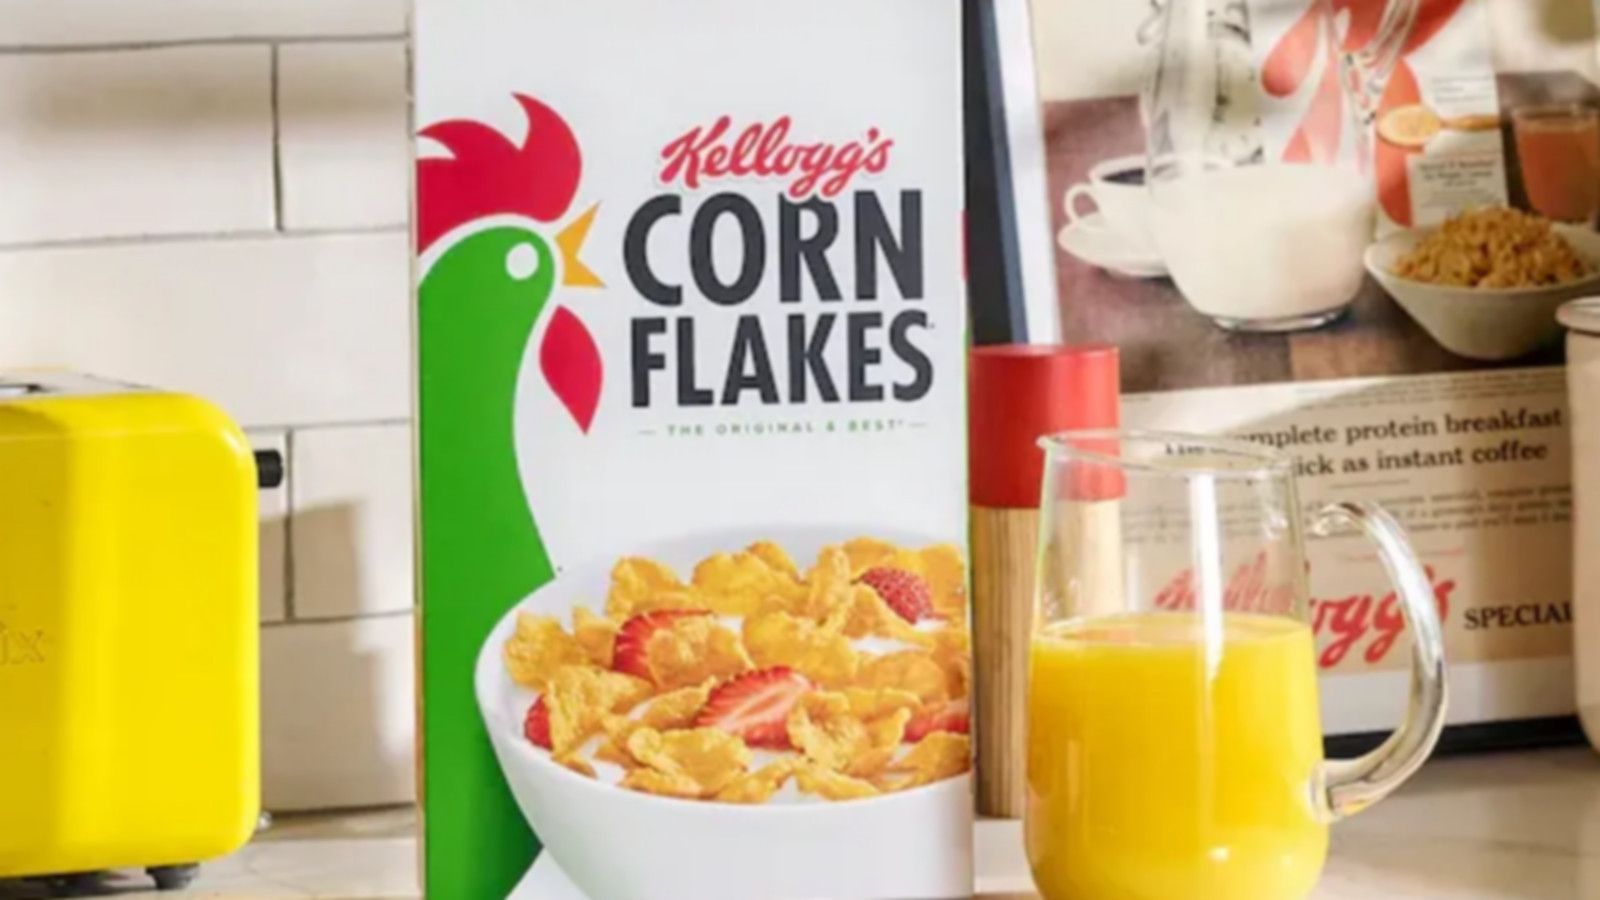
Flagship merchandise of WK Kellogg

The investment appeal of WK Kellogg Co (KLG) is based on the high efficiency of its automated mass-market breakfast production, which reduces unit costs. This ratio compares the market value of the business to its annual net income, and the capitalization-to-earnings valuation analysis on GURU.Markets allows for the identification of pricing anomalies, confirming the company's fundamental stability or cyclical risks.

Competing companies

Kraft Heinz Company (KHC) - Business Payback Period|Price to Earnings Ratio Kellanova Corp (K)|General Mills Corp - Price to Earnings Multiple|P/E Multiple MKC (mccormickcorporation.com)|Business Payback Period JBS N.V. (JBS)|HRL - Price to Earnings Ratio|Business Payback Period Smucker's SJM|PPC: P/E Multiple|Campbell Soup Co. - Company Value to Net Income|SFD (Smithfield) - P/E Multiple|INGR: Company Value to Net Income|Price to Earnings Ratio LW (Lamb Weston Holdings, Inc.)|BRFS - Market Cap to Earnings|P/E Multiple POST (Post Holdings, Inc.)|MZTI: Price to Earnings Multiple|BRBR: Price to Earnings Ratio|Market Cap to Earnings tootsie.com|Flowers Foods Corp (FLO) - Price to Earnings Ratio|Market Cap to Net Income SMPL (Simply Good Foods Co.)|Price to Earnings Ratio nomadfoods.com|Market Cap to Earnings J&J Snack Foods Inc JJSF|P/E Multiple UTZ|TreeHouse Foods - Price to Earnings Multiple|P/E Multiple STKL (SunOpta Corp)|JBSS: Price to Earnings Multiple|Seneca Foods - P/E Multiple|LWAY: Price to Earnings Ratio|MAMA: P/E Multiple|Market Cap to Net Income Ratio B&G Foods BGS|Price to Earnings Ratio BYND|Market Cap to Earnings Hain Celestial HAIN|P/E Multiple BRID|Wing Yip Food Group (WYHG) - Market Cap to Net Income Ratio|Laird Superfood, Inc. - Price to Earnings Ratio|P/E Multiple Borealis Foods, Inc. BRLS|FARM - Price to Earnings Ratio|Market Cap to Earnings BranchOut Food, Inc.|Pinnacle Food Group Inc (PFAI) - Price to Earnings Ratio|Market Cap to Earnings Sow Good Inc (SOWG)|Price to Earnings Ratio TWG|Price to Earnings Ratio STKH|Price to Earnings Ratio Blue Star Foods Corp (BSFC)|FREE (Whole Earth) - Company Value to Net Income|Lancaster Colony Corp. - Price to Earnings Ratio|Real Good Foods (RGF) - Market Cap to Earnings|Stryve Foods - P/E Multiple|SOVO (sovosbrands.com) - Price to Earnings Multiple