BRLS: Borealis Foods, Inc. Market Cap to Revenue Ratio
Corporate company logo of Borealis Foods Inc. (BRLS)

Rising global commodity prices and logistical disruptions are squeezing margins at Borealis Foods Inc. (BRLS). The P/S multiple trend helps assess the market's reaction to these risks, with the indicator currently standing at 0.70. While expanding its retail footprint in the US limits current profits, ownership of state-of-the-art health food production plants provides the company with stable growth potential.

BRLS: borealisfoods.ca P/S Multiple 05/31/2024 - 11/14/2026

Metric breakdowns and analytics for Borealis Foods Inc. (BRLS)
- current quotes and average value forecast:
General company analysis:Borealis Foods, Inc. (BRLS)
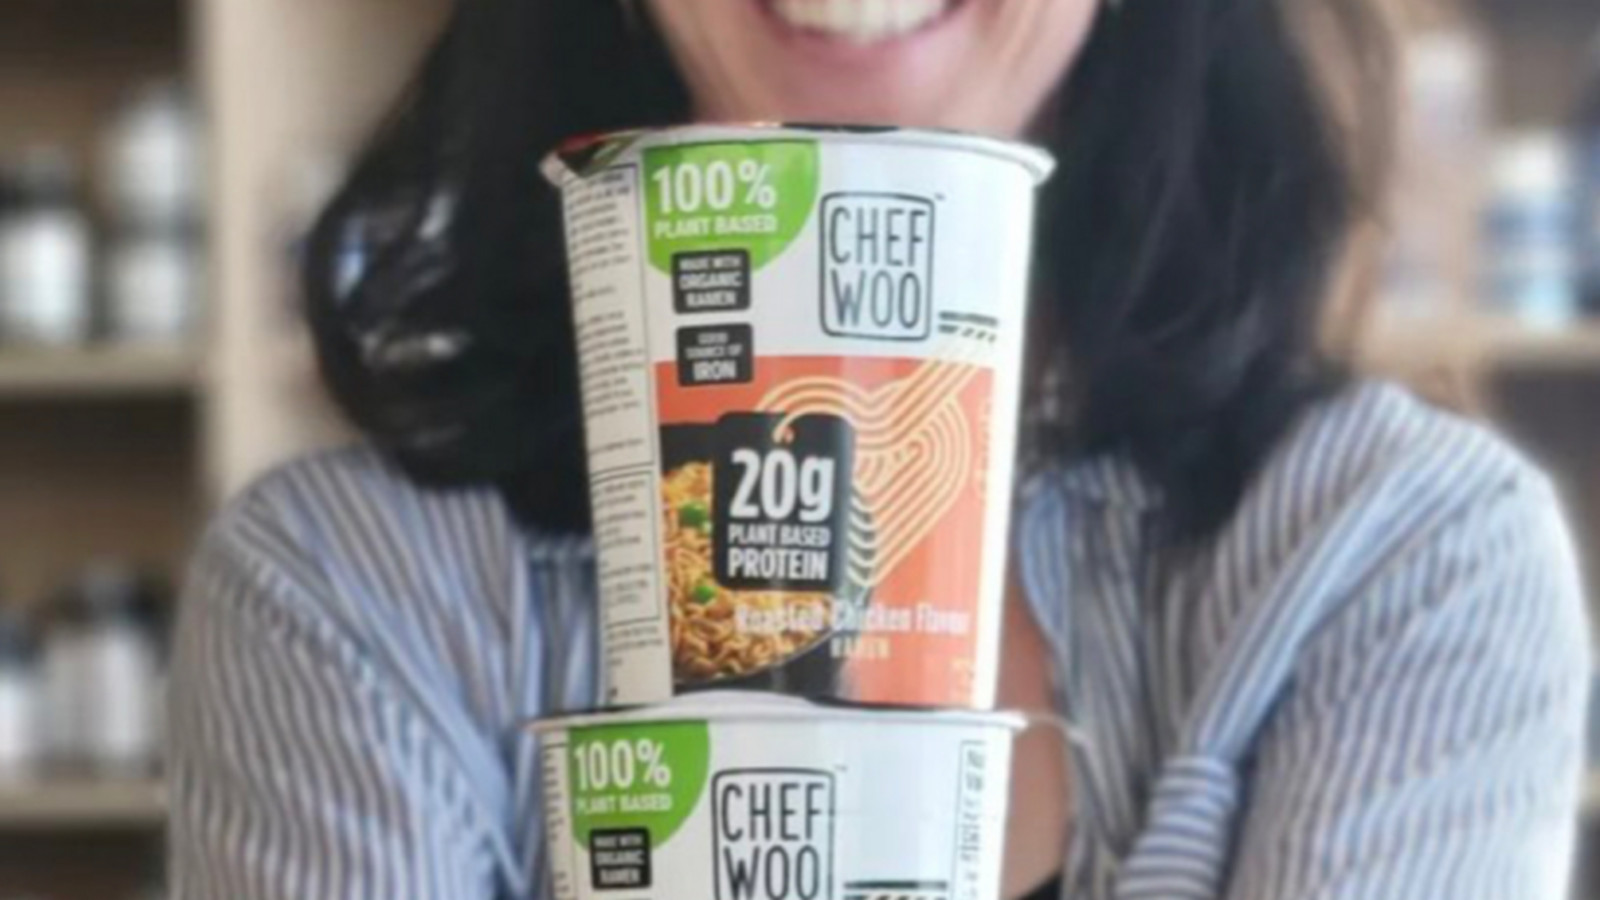
Mass-produced product of Borealis Foods Inc.

The countercyclical nature of Borealis Foods Inc. (BRLS) ensures stable demand for budget products even amidst macroeconomic shocks. The P/S multiple compares total market capitalization to annual sales volume, determining the cost of each unit of revenue. This metric allows for an assessment of the premium paid for the asset relative to its operational efficiency. By analyzing changes in the price-to-sales ratio, an investor can identify critical valuation thresholds and avoid purchasing overvalued securities.

Competing companies

KHC - Price to Sales|P/S Multiple K (Kellogg's)|GIS: Market Cap to Revenue Ratio|MKC: Market Cap to Revenue|Market Capitalization-to-Revenue Ratio JBS (JBS N.V.)|HRL: P/S Multiple|Price-to-Sales Ratio SJM (jmsmucker.com)|Price-to-Revenue Ratio Pilgrim's Pride Corporation|Price to Sales Campbell Soup CPB|Price-to-Revenue Ratio Smithfield Foods, Inc. (SFD)|INGR - Price to Sales|P/S Multiple LW (Lamb Weston Holdings)|BRFS: Market Cap to Revenue Ratio|Post Holdings - P/S Multiple|MZTI: Price-to-Revenue Ratio|BellRing Brands Inc (BRBR) - Price-to-Revenue Ratio|Price to Sales Tootsie Roll Corp (TR)|Price-to-Revenue Ratio Flowers Foods, Inc.|SMPL: Market Capitalization-to-Revenue Ratio|P/S Multiple NOMD|KLG - Price to Sales|P/S Multiple JJSF (J&J Snack Foods Corp.)|P/S Multiple Utz Brands Corp UTZ|THS - Price-to-Revenue Ratio|STKL: Price-to-Revenue Ratio|JBSS: P/S Multiple|SENEA - Price-to-Revenue Coefficient|Price-to-Revenue Ratio Lifeway Kefir|Mama's Creations Corp (MAMA) - Price-to-Revenue Coefficient|Market Cap to Revenue BGS (B&G Foods, Inc.)|BYND (beyondmeat.com) - Market Capitalization-to-Revenue Ratio|P/S Multiple HAIN (The Hain Celestial Group)|BRID (Bridgford Foods Corp.) - Price-to-Sales Ratio|WYHG - Price-to-Revenue Ratio|Price to Sales lairdsuperfood.com|farmerbros.com (FARM) - Price-to-Revenue Ratio|Price to Sales BranchOut Food (BOF)|PFAI (Pinnacle Food Group Inc) - P/S Multiple|Market Cap to Revenue Ratio SOWG (Sow Good, Inc.)|Price-to-Revenue Ratio Top Wealth Group Holding Ltd (TWG)|Price-to-Revenue Coefficient Steakholder Foods Corp|Blue Star Foods Corp. - Market Cap to Revenue|Market Capitalization-to-Revenue Ratio FREE|Lancaster Colony Corporation - P/S Multiple|Price-to-Revenue Coefficient Real Good Food RGF|Stryve (SNAX) - Price-to-Revenue Ratio|Market Cap to Revenue Ratio SOVO