SFD - Smithfield Market Capitalization-to-Revenue Ratio
Corporate company logo of Smithfield (SFD)

The price-to-sales ratio trend on the GURU.Markets chart demonstrates the market value of Smithfield Foods Inc (SFD). The current value of 0.50 determines the latest valuation metric, which is based on global wholesale meat supplies to retail and restaurants. Margin stability is supported by the company's leadership in pork processing. Vertical integration of production in the US and Asia effectively mitigates commodity risks.

Smithfield Foods, Inc. (SFD) - Price-to-Revenue Ratio from 01/29/2025 to 11/13/2026

Analytical breakdowns for Smithfield Foods, Inc. (SFD)
- stock price and consensus target price:
Fundamental company analysis:SFD, smithfieldfoods.com
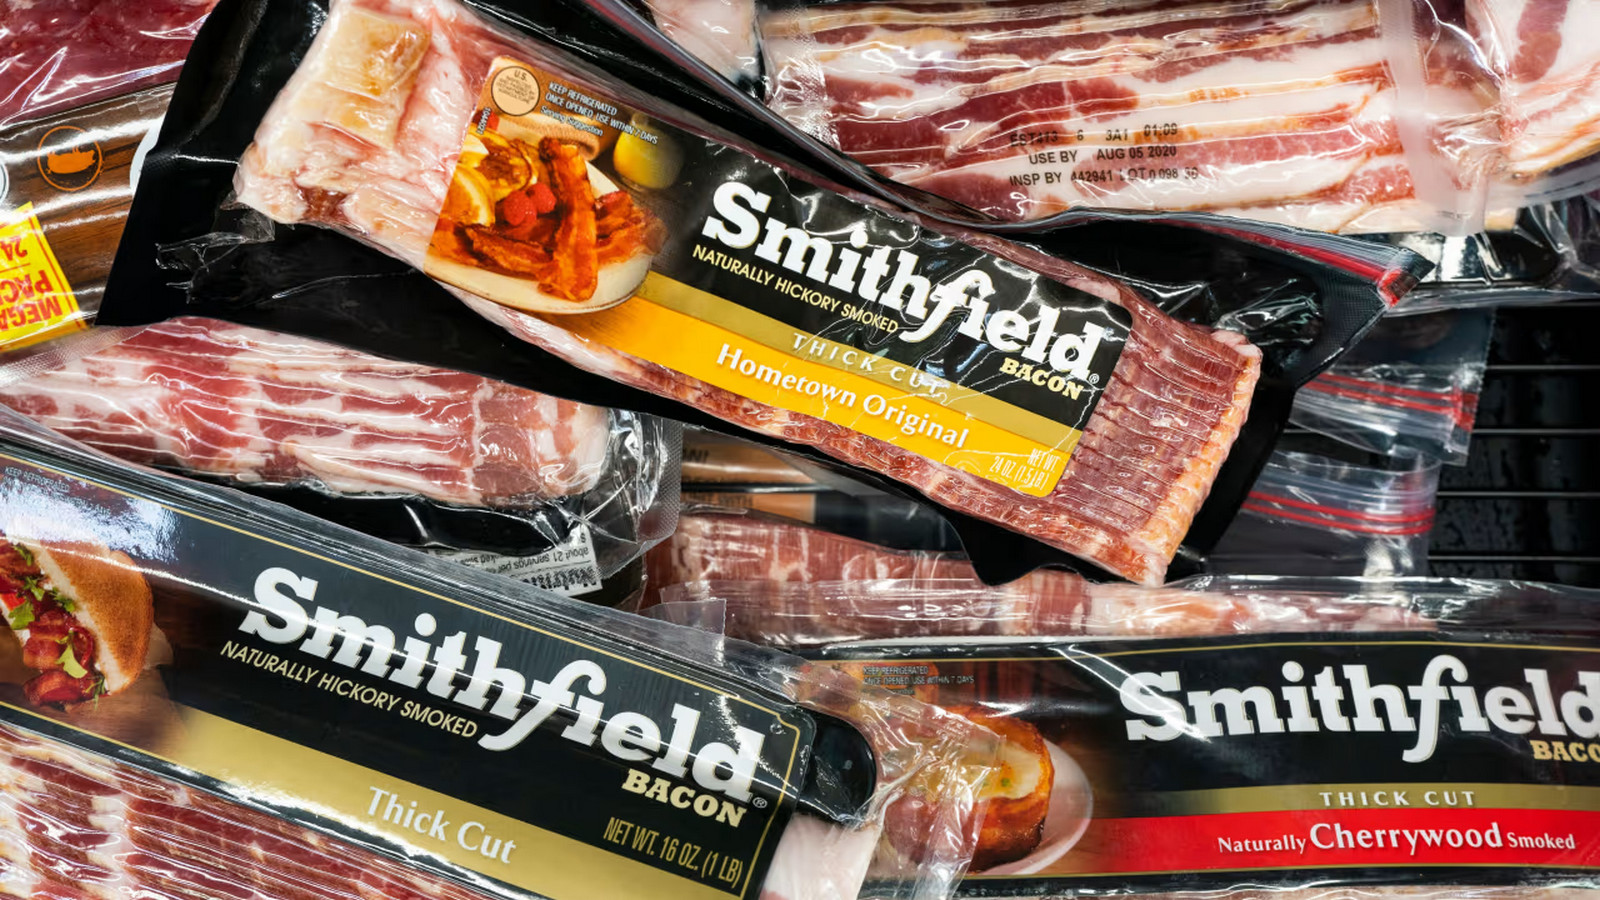
Mass-produced product of smithfieldfoods.com

Assessing asset quality via P/S allows for the determination of the market value of a single dollar of sales, identifying whether a business is overbought or undervalued relative to its actual turnover. By analyzing the revenue multiple, an investor evaluates the efficiency of the vertical integration of Smithfield Foods Inc. (SFD), where control over the entire pork production chain directly impacts revenue scalability and the company's ultimate market value.

Competitors of Smithfield Foods Inc

kraftheinzcompany.com - Market Cap to Revenue Ratio|Kellogg's - Market Cap to Revenue|Market Capitalization-to-Revenue Ratio GIS|McCormick & Co. - P/S Multiple|Price-to-Sales Ratio JBS|Hormel Foods Corporation (HRL) - Price-to-Revenue Ratio|Price to Sales jmsmucker.com (SJM)|Price-to-Revenue Ratio Pilgrim's Pride Corporation|Price to Sales Campbell Soup CPB|P/S Multiple INGR|Lamb Weston Inc. - Market Cap to Revenue Ratio|Price-to-Revenue Ratio BRF S.A. BRFS|Price-to-Revenue Coefficient postholdings.com (POST)|MZTI - Price-to-Revenue Ratio|Premier Protein (BRBR) - Market Cap to Revenue|TR: P/S Multiple|FLO - Price-to-Revenue Coefficient|Market Cap to Revenue SMPL|NOMD (nomadfoods.com) - Market Cap to Sales Volume|P/S Multiple KLG|JJSF (J&J Snack Foods Corp) - Market Capitalization-to-Revenue Ratio|P/S Multiple UTZ (Utz Quality Foods)|THS (TreeHouse Foods Inc.) - Price-to-Sales Ratio|SunOpta Inc. - P/S Multiple|Price-to-Revenue Coefficient John B. Sanfilippo & Son JBSS|SENEA: P/S Multiple|Price to Sales Lifeway Foods Inc (LWAY)|Price-to-Revenue Ratio MamaMancini's|Price-to-Revenue Ratio BGS|P/S Multiple BYND|hain.com - Market Cap to Revenue Ratio|Bridgford Foods Corporation - Market Cap to Revenue|Market Capitalization-to-Revenue Ratio WYHG|Laird Superfood, Inc. - P/S Multiple|Price-to-Sales Ratio BRLS|farmerbros.com (FARM) - Price-to-Revenue Ratio|Price to Sales BranchOut Food (BOF)|Price-to-Revenue Ratio Pinnacle Food Group Inc|Price to Sales Sow Good, Inc. SOWG|P/S Multiple TWG|Steakholder Foods Corp - Market Cap to Revenue Ratio|Price-to-Revenue Ratio Blue Star Foods Corp. BSFC|Price-to-Revenue Coefficient Whole Earth Brands Inc. (FREE)|LANC: Market Cap to Revenue|Market Capitalization-to-Revenue Ratio RGF (Real Good Food)|SNAX: P/S Multiple|SOVO - Price-to-Revenue Coefficient