BRBR: BellRing Brands Corp Market Cap to Revenue Ratio
Corporate company logo of BellRing Brands Inc (BRBR)

BellRing Brands, Inc. (BRBR) is aggressively scaling its protein drink production volumes while expanding into new retail chains. The historical P/S reflects current market dynamics, with the metric currently fixed at 0.50. While automated packaging and AI-driven accounting optimize costs, raw material price volatility and fierce competition create certain risks for the shares' fundamental value.

BRBR: BellRing Brands Corp P/S Multiple 07/04/2022 - 11/17/2026

Metric breakdowns and analytics for Premier Protein (BRBR)
- current quotes and average value forecast:
General company analysis:BellRing Brands (BRBR)
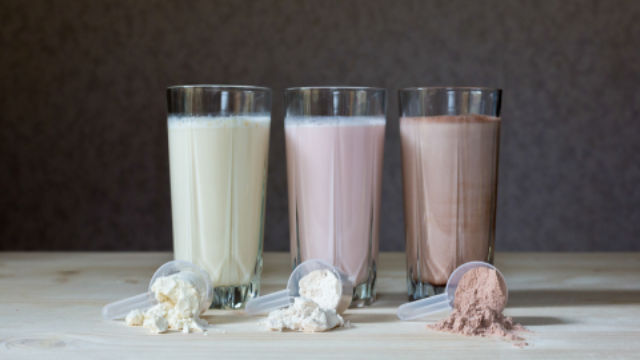
Mass-produced product of BellRing Brands

For the investor, the valuation of BellRing Brands, Inc. (BRBR) is based on the brand's ability to maintain premium pricing power within the health and wellness segment, which minimizes sales dependence on inflationary shocks. This indicator measures the market value of the business relative to its operating income, allowing for the identification of overvaluation or hidden revenue degradation via the market capitalization-to-revenue ratio to determine long-term investment attractiveness.

Competing companies

Kraft Heinz Corp - Market Cap to Revenue Ratio|Price-to-Revenue Ratio kelloggcompany.com K|Market Capitalization-to-Revenue Ratio GIS|McCormick & Co. - P/S Multiple|Price-to-Sales Ratio JBS|Hormel Corp (HRL) - Price-to-Revenue Ratio|Price to Sales J.M. Smucker (SJM)|Price-to-Revenue Ratio pilgrims.com|Price to Sales Campbell Soup Co. CPB|P/S Multiple SFD|INGR - Price to Sales|P/S Multiple LW (lambweston.com)|BRFS: Market Cap to Revenue Ratio|POST - Price-to-Revenue Ratio|T. Marzetti Company - Market Cap to Sales Volume|TR (Tootsie Roll Industries Inc) - Market Cap to Revenue|Price to Sales Flowers Foods (FLO)|SMPL (Simply Good Foods Co.) - P/S Multiple|Market Cap to Revenue Nomad Foods (NOMD)|P/S Multiple KLG|JJSF (J&J Snack Foods Inc) - Market Capitalization-to-Revenue Ratio|Price-to-Revenue Ratio Utz Brands, Inc. UTZ|TreeHouse Foods (THS) - Price to Sales|STKL: Market Cap to Revenue|JBSS: Price-to-Revenue Ratio|SENEA: P/S Multiple|Price to Sales Lifeway Foods, Inc. (LWAY)|Price-to-Revenue Ratio Mama's Creations, Inc.|B&G Foods (BGS) - Price-to-Revenue Coefficient|P/S Multiple BYND|HAIN (The Hain Celestial Group) - Market Capitalization-to-Revenue Ratio|Bridgford Foods Corp - Market Cap to Revenue|WYHG (Wing Yip Food) - Price-to-Sales Ratio|Laird Superfood - P/S Multiple|Price to Sales Borealis Foods, Inc.|FARM (Farmer Bros. Co.) - Market Cap to Revenue|Price to Sales BranchOut Food, Inc. (BOF)|PFAI (Pinnacle Food Group Inc.) - P/S Multiple|thisissowgood.com (SOWG) - Price-to-Revenue Coefficient|Market Cap to Revenue TWG (Top Wealth Group Ltd)|STKH - Price to Sales|Price-to-Revenue Ratio bluestarfoods.com BSFC|P/S Multiple Whole Earth Brands FREE|LANC: Market Cap to Revenue|Price to Sales The Real Good Food Company Inc.|SNAX (stryve.com) - Market Cap to Revenue|SOVO - Price-to-Revenue Coefficient