MAMA: Mama's Creations Corp Market Cap to Revenue Ratio
Corporate company logo of MamaMancini's (MAMA)

Targeting the US market, Mama's Creations, Inc. (MAMA) remains vulnerable to raw material inflation, yet is expanding its reach through partnerships with major supermarkets. The price-to-sales multiple shows a metric value of 3.00, helping to determine the fair value of assets. Simultaneously, Mama's Creations, Inc. (MAMA) is scaling the use of autonomous robots and driverless forklifts across its logistics centers.

MAMA: Mama's Creations Corp P/S Multiple 02/21/2024 - 11/13/2026

Metric breakdowns and analytics for MamaMancini's (MAMA)
- current quotes and average value forecast:
General company analysis:mamascreations.com (MAMA)
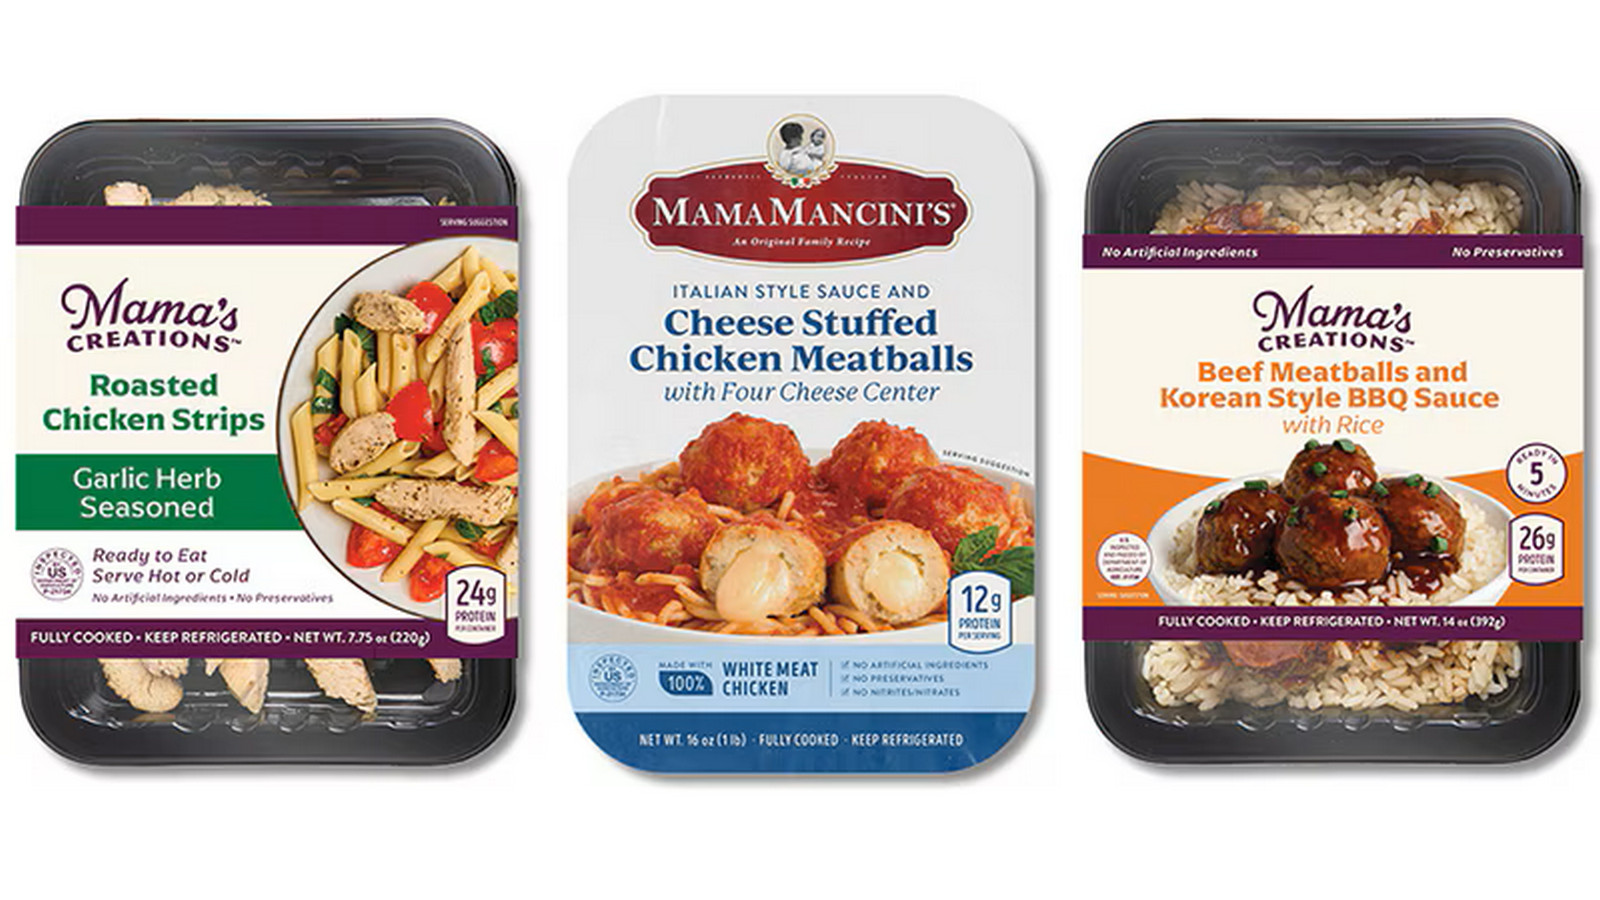
Mass-produced product of Mama's Creations

Professional managers utilize fundamental filters to assess the market value of a business relative to its operational efficiency. The ratio of market capitalization to sales volume, displayed via the rolling P/S of Mama's Creations, Inc. (MAMA), allows for the identification of overvaluation amid raw material inflation or declining demand due to competition, turning this chart into an indicator of the real value of every unit of revenue for Mama's Creations, Inc. (MAMA).

Competitors of Mama's Creations, Inc.

KHC - Price to Sales|P/S Multiple K (Kellogg's)|GIS: Market Cap to Revenue Ratio|MKC: Market Cap to Revenue|Market Capitalization-to-Revenue Ratio JBS (JBS N.V.)|HRL: P/S Multiple|Price-to-Sales Ratio SJM (jmsmucker.com)|Price-to-Revenue Ratio Pilgrim's Pride Corporation|Price to Sales Campbell Soup CPB|Price-to-Revenue Ratio Smithfield Foods, Inc. (SFD)|INGR - Price to Sales|P/S Multiple LW (Lamb Weston Holdings)|BRFS: Market Cap to Revenue Ratio|POST - Price-to-Revenue Ratio|The Marzetti Company (MZTI) - Market Cap to Revenue|BRBR: P/S Multiple|Tootsie Roll Corp (TR) - P/S Multiple|Price-to-Revenue Ratio Flowers Foods, Inc.|Market Cap to Revenue The Simply Good Foods (SMPL)|P/S Multiple NOMD|P/S Multiple WK Kellogg Corporation (KLG)|Price-to-Revenue Ratio J&J Snack Foods Corp. JJSF|Price-to-Revenue Coefficient Utz Brands Corp (UTZ)|THS: Market Cap to Revenue|Market Capitalization-to-Revenue Ratio STKL (sunopta.com)|JBSS: P/S Multiple|Market Cap to Revenue Seneca Foods Corp|Price-to-Revenue Ratio Lifeway Kefir|BGS: Market Capitalization-to-Revenue Ratio|P/S Multiple BYND|HAIN - Price to Sales|P/S Multiple BRID (Bridgford Foods Corporation)|P/S Multiple Wing Yip Food Holdings Group WYHG|LSF: Market Cap to Revenue|borealisfoods.ca - Market Cap to Sales Volume|FARM: P/S Multiple|BOF - Price-to-Revenue Coefficient|Price-to-Revenue Ratio Pinnacle Food Group Inc|Price to Sales Sow Good, Inc. SOWG|Price-to-Revenue Ratio Top Wealth Group Holding Ltd (TWG)|Steakholder Foods Corp - Market Cap to Revenue Ratio|Price-to-Revenue Ratio Blue Star Foods Corp. BSFC|Price-to-Revenue Coefficient Whole Earth Brands Inc. (FREE)|LANC: Market Cap to Revenue|Market Capitalization-to-Revenue Ratio RGF (Real Good Food)|SNAX: P/S Multiple|SOVO - Price-to-Revenue Coefficient