POST: Post Corp Market Cap to Revenue Ratio
Corporate company logo of Post Consumer Brands (POST)

The price-to-sales valuation demonstrates the defensive nature of the Post Holdings, Inc. (POST) business during downturns, when demand for cereals remains stable. A strategy of serial acquisitions of distressed assets followed by cost reductions drives profit growth. Development relies on expansion into the pet food segment and pricing power. Meanwhile, the 0.40 level captures the latest market expectations regarding the real income of Post Holdings, Inc. (POST).

POST: Post Corp P/S Multiple 07/04/2022 - 11/13/2026

Metric breakdowns and analytics for Post Consumer Brands (POST)
- current quotes and average value forecast:
General company analysis:postholdings.com (POST)
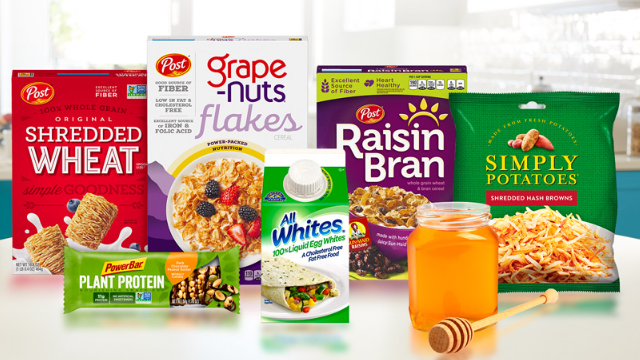
Mass-produced product of Post Holdings

Steady demand for recognizable breakfast cereal brands guarantees Post Holdings, Inc. (POST) a consistent revenue stream, making the P/S multiple chart a reliable tool for monitoring market expectations. The price-to-sales ratio measures the cost of one dollar of revenue, allowing investors to identify unjustified price overheating relative to the actual scale of the business and determine a fair valuation level for the asset.

Competitors of Post Holdings, Inc.

KHC - Price to Sales|P/S Multiple K (Kellogg's)|GIS: Market Cap to Revenue Ratio|MKC: Market Cap to Revenue|Market Capitalization-to-Revenue Ratio JBS (JBS N.V.)|HRL: P/S Multiple|Price-to-Sales Ratio SJM (jmsmucker.com)|Price-to-Revenue Ratio Pilgrim's Pride Corporation|Price to Sales Campbell Soup CPB|Price-to-Revenue Ratio Smithfield Foods, Inc. (SFD)|INGR - Price to Sales|P/S Multiple LW (Lamb Weston Holdings)|BRFS: Market Cap to Revenue Ratio|MZTI - Price-to-Revenue Ratio|Price-to-Sales Ratio BRBR|Tootsie Roll Industries Inc (TR) - Price-to-Revenue Ratio|Price to Sales Flowers Foods Corp (FLO)|Price-to-Revenue Ratio Quest Nutrition|nomadfoods.com (NOMD) - Price-to-Revenue Coefficient|Market Cap to Revenue KLG (WK Kellogg)|Market Cap to Sales Volume JJSF|Utz Quality Foods - Market Cap to Revenue|Market Capitalization-to-Revenue Ratio THS|SunOpta Inc. - P/S Multiple|Market Capitalization-to-Revenue Ratio JBSS (John B. Sanfilippo & Son)|Seneca Foods Corporation (SENEA) - Price-to-Revenue Ratio|Price to Sales Lifeway Foods Inc (LWAY)|Price-to-Revenue Ratio MamaMancini's|Price-to-Revenue Ratio BGS|P/S Multiple BYND|hain.com - Market Cap to Revenue Ratio|P/S Multiple BRID (Bridgford Foods Corporation)|Price-to-Revenue Coefficient Wing Yip Food Holdings Group (WYHG)|LSF - Price-to-Revenue Ratio|BRLS (borealisfoods.ca) - Market Cap to Revenue Ratio|FARM: P/S Multiple|Price-to-Revenue Multiple BranchOut Food BOF|Price-to-Revenue Ratio Pinnacle Food Group Inc|Sow Good, Inc. (SOWG) - Price-to-Revenue Coefficient|Market Cap to Revenue TWG (Top Wealth Group Holding Ltd)|STKH (Steakholder Foods Corp) - Market Capitalization-to-Revenue Ratio|P/S Multiple BSFC (Blue Star Foods Corp.)|Price-to-Revenue Coefficient Whole Earth Brands Inc. (FREE)|LANC - Price-to-Revenue Ratio|RGF (Real Good Food) - Market Cap to Revenue Ratio|SNAX: P/S Multiple|Market Cap to Revenue Sovos Brands Corp