STKL: SunOpta Foods Market Cap to Revenue Ratio
Corporate company logo of SunOpta Corp (STKL)

Effective delegation of raw material procurement to farmers, combined with internal packaging control, supports the stability of SunOpta Inc. The company's price/sales multiple visualizes the impact of these processes on valuation, where the 0.90 metric reflects current dynamics. Rising demand for plant-based beverages and private label products is driving expansion, while plant scale and B2B contracts ensure business resilience in a competitive environment.

STKL: SunOpta Foods P/S Multiple 07/04/2022 - 05/16/2026

Metric breakdowns and analytics for SunOpta Corp (STKL)
- current quotes and average value forecast:
General company analysis:sunopta.com (STKL)
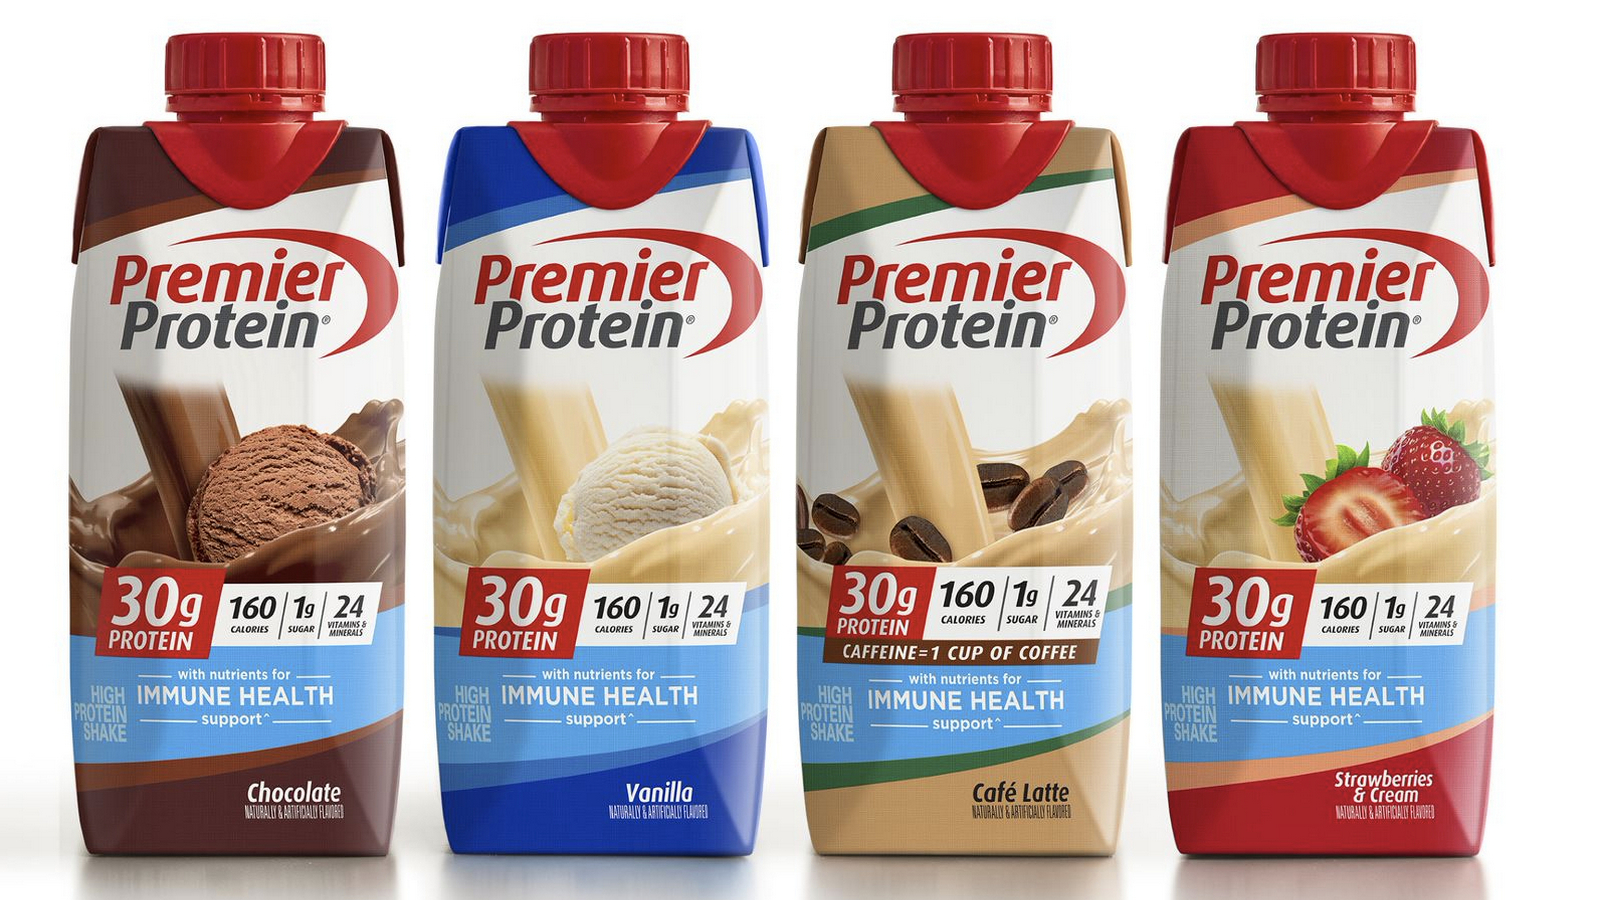
Mass-produced product of SunOpta

The P/S multiple compares the market capitalization of SunOpta Inc. (STKL) with its actual revenue, allowing for a valuation of the business relative to its generated cash flow. The company's current P/S ratio of 0.90 reflects the market's assessment of sales efficiency, which is supported by steady demand for plant-based beverages and a stable inflow of capital from this segment.

Competitors of SunOpta Inc.

KHC - Price to Sales|P/S Multiple K (Kellogg's)|GIS: Market Cap to Revenue Ratio|MKC: Market Cap to Revenue|Market Capitalization-to-Revenue Ratio JBS (JBS N.V.)|HRL: P/S Multiple|Price-to-Sales Ratio SJM (jmsmucker.com)|Price-to-Revenue Ratio Pilgrim's Pride Corporation|Price to Sales Campbell Soup CPB|Price-to-Revenue Ratio Smithfield Foods, Inc. (SFD)|INGR - Price to Sales|P/S Multiple LW (Lamb Weston Holdings)|BRFS: Market Cap to Revenue Ratio|POST - Price-to-Revenue Ratio|Price-to-Revenue Coefficient The Marzetti Company MZTI|BRBR (BellRing Brands Inc) - Market Cap to Revenue|Tootsie Roll Corp (TR) - P/S Multiple|Price-to-Revenue Ratio Flowers Foods, Inc.|Market Cap to Revenue Ratio SMPL (The Simply Good Foods)|Price-to-Revenue Ratio Nomad Foods (NOMD)|KLG - Price to Sales|Price-to-Revenue Ratio J&J Snack Foods Corp. JJSF|UTZ (Utz Brands Corp) - Price-to-Sales Ratio|THS: Market Cap to Revenue|John B. Sanfilippo & Son - Market Cap to Sales Volume|SENEA: P/S Multiple|Lifeway Foods Inc (LWAY) - P/S Multiple|Market Cap to Revenue MAMA|BGS: Market Capitalization-to-Revenue Ratio|P/S Multiple BYND|Price-to-Revenue Coefficient hain.com|Price-to-Revenue Ratio Bridgford Foods Corporation BRID|WYHG: Market Cap to Revenue Ratio|Laird Superfood, Inc. - P/S Multiple|borealisfoods.ca (BRLS) - Market Cap to Revenue|FARM (farmerbros.com) - Market Cap to Revenue|BOF - Price-to-Revenue Coefficient|Price-to-Revenue Ratio Pinnacle Food Group Inc|Sow Good, Inc. (SOWG) - Price-to-Revenue Coefficient|Market Cap to Revenue TWG (Top Wealth Group Holding Ltd)|Market Cap to Sales Volume STKH|Price-to-Revenue Ratio Blue Star Foods Corp. BSFC|P/S Multiple Whole Earth Brands Inc. FREE|LANC - Price-to-Revenue Ratio|RGF: Price-to-Revenue Ratio|Stryve (SNAX) - Price-to-Revenue Ratio|SOVO - Price-to-Revenue Coefficient