SJM - J.M. Smucker Market Capitalization-to-Revenue Ratio
Corporate company logo of J.M. Smucker (SJM)

The J. M. Smucker Company (SJM) is optimizing costs by implementing AGV systems and warehouse robotics, which stabilizes the price-to-sales ratio. This metric currently holds around 1.60, reflecting a market balance. Mark Smucker is refreshing the portfolio by divesting unprofitable assets. This premiumization strategy, driven by the Hostess acquisition and the expansion of the pet food segment, effectively protects business margins from inflationary raw material pressures.

Smucker (SJM) - Price-to-Revenue Ratio from 07/04/2022 to 11/17/2026

Analytical breakdowns for Smucker's (SJM)
- stock price and consensus target price:
Summary company analytics:Smucker's
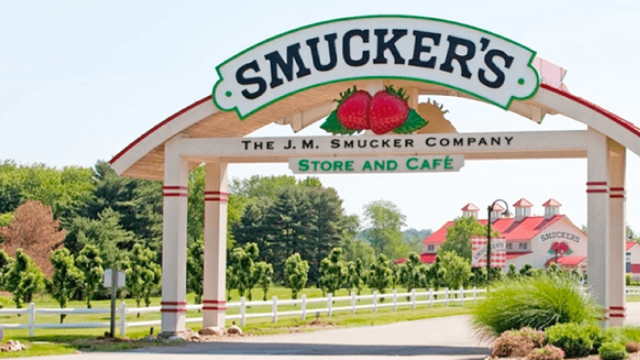
Mass-produced product of jmsmucker.com

The P/S ratio reflects the market value of the business relative to its annual revenue, allowing for an assessment of the premium investors are willing to pay per unit of sales. For The J. M. Smucker Company (SJM), whose coffee and pet food brands ensure stable demand, this metric demonstrates the capital's resilience to inflation, while the historical P/S trend helps determine the balance between asset undervaluation and the risk of stagnation for a mature business.

Competing companies

Kraft Heinz Corp - Market Cap to Revenue Ratio|Price-to-Revenue Ratio kelloggcompany.com K|Market Capitalization-to-Revenue Ratio GIS|McCormick & Co. - P/S Multiple|Price-to-Sales Ratio JBS|Hormel Corp (HRL) - Price-to-Revenue Ratio|Price to Sales Pilgrim's (PPC)|Price-to-Revenue Ratio campbellsoupcompany.com|Price to Sales Smithfield Foods, Inc. SFD|Price-to-Revenue Ratio Ingredion Inc. (INGR)|Price-to-Revenue Ratio LW (Lamb Weston Holdings)|P/S Multiple BRFS (Sadia)|POST: Market Cap to Revenue Ratio|MZTI: Market Cap to Revenue|BRBR: Price-to-Revenue Ratio|TR (Tootsie Roll Industries Inc) - Market Cap to Revenue|Price to Sales Flowers Foods (FLO)|SMPL (Simply Good Foods Co.) - P/S Multiple|Market Cap to Revenue Nomad Foods (NOMD)|P/S Multiple KLG|JJSF (J&J Snack Foods Inc) - Market Capitalization-to-Revenue Ratio|Price-to-Revenue Ratio Utz Brands, Inc. UTZ|TreeHouse Foods (THS) - Price to Sales|STKL: Market Cap to Revenue|JBSS: Price-to-Revenue Ratio|SENEA: P/S Multiple|Price to Sales Lifeway Foods, Inc. (LWAY)|Price-to-Revenue Ratio Mama's Creations, Inc.|B&G Foods (BGS) - Price-to-Revenue Coefficient|P/S Multiple BYND|HAIN (The Hain Celestial Group) - Market Capitalization-to-Revenue Ratio|Bridgford Foods Corp - Market Cap to Revenue|WYHG (Wing Yip Food) - Price-to-Sales Ratio|Laird Superfood - P/S Multiple|Price to Sales Borealis Foods, Inc.|FARM (Farmer Bros. Co.) - Market Cap to Revenue|Price to Sales BranchOut Food, Inc. (BOF)|PFAI (Pinnacle Food Group Inc.) - P/S Multiple|thisissowgood.com (SOWG) - Price-to-Revenue Coefficient|Market Cap to Revenue TWG (Top Wealth Group Ltd)|STKH - Price to Sales|Price-to-Revenue Ratio bluestarfoods.com BSFC|P/S Multiple Whole Earth Brands FREE|LANC: Market Cap to Revenue|Price to Sales The Real Good Food Company Inc.|SNAX (stryve.com) - Market Cap to Revenue|SOVO - Price-to-Revenue Coefficient