SMPL: The Simply Good Foods Market Cap to Revenue Ratio
Corporate company logo of Atkins (SMPL)

Loyalty among health-conscious consumers and trust in the Atkins and Quest brands create a resilient foundation for The Simply Good Foods (SMPL). On the GURU.Markets platform, the company's P/S ratio serves as an indicator of market expectations, and this metric equals 0.80. Growth is driven by the popularity of low-carb diets and the integration of OWYN. Scaling efficiency is based on the robotization of production lines and the automation of raw material inventory management.

SMPL: Quest Nutrition P/S Multiple 07/04/2022 - 11/13/2026

Metric breakdowns and analytics for Atkins (SMPL)
General company analysis:thesimplygoodfoodscompany.com (SMPL)
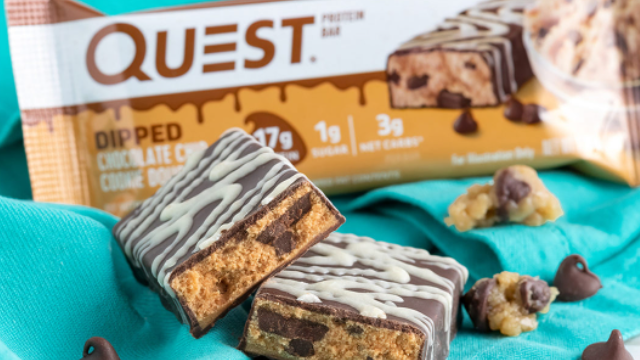
Mass-produced product of Simply Good Foods

Analyzing market value relative to generated income is critical for selecting assets with a high margin of safety. This ratio measures the premium the market is willing to pay per unit of revenue, which, combined with the production localization of The Simply Good Foods (SMPL) and its resilience to external shocks, allows for an objective assessment of overvaluation risk via the market cap-to-revenue ratio.

Who The Simply Good Foods competes with

KHC - Price to Sales|P/S Multiple K (Kellogg's)|GIS: Market Cap to Revenue Ratio|MKC: Market Cap to Revenue|Market Capitalization-to-Revenue Ratio JBS (JBS N.V.)|HRL: P/S Multiple|Price-to-Sales Ratio SJM (jmsmucker.com)|Price-to-Revenue Ratio Pilgrim's Pride Corporation|Price to Sales Campbell Soup CPB|Price-to-Revenue Ratio Smithfield Foods, Inc. (SFD)|INGR - Price to Sales|P/S Multiple LW (Lamb Weston Holdings)|BRFS: Market Cap to Revenue Ratio|POST: Market Cap to Revenue|The Marzetti Company - Market Cap to Sales Volume|BRBR: P/S Multiple|Tootsie Roll Corp - Market Capitalization-to-Revenue Ratio|FLO (Flowers Foods, Inc.) - P/S Multiple|Price to Sales nomadfoods.com NOMD|Market Cap to Revenue KLG (WK Kellogg)|JJSF (J&J Snack Foods Corp) - Market Capitalization-to-Revenue Ratio|Price-to-Revenue Ratio Utz Quality Foods UTZ|Price-to-Revenue Coefficient TreeHouse Foods Inc. (THS)|SunOpta Inc. - P/S Multiple|Price-to-Revenue Coefficient John B. Sanfilippo & Son JBSS|Seneca Foods Corporation (SENEA) - Price-to-Revenue Ratio|Market Cap to Revenue Lifeway Foods Inc|Price-to-Revenue Ratio MamaMancini's|B&G Foods Holding - Price-to-Sales Ratio|Price-to-Revenue Ratio Beyond Meat, Inc. (BYND)|Price-to-Revenue Ratio HAIN (hain.com)|Bridgford Foods Corporation - Market Cap to Revenue|Wing Yip Food Holdings Group (WYHG) - Price to Sales|LSF: Market Cap to Revenue|Market Capitalization-to-Revenue Ratio BRLS (borealisfoods.ca)|FARM: P/S Multiple|Price-to-Revenue Multiple BranchOut Food BOF|Price-to-Revenue Ratio Pinnacle Food Group Inc|Price to Sales Sow Good, Inc. SOWG|Price-to-Revenue Ratio Top Wealth Group Holding Ltd (TWG)|STKH - Price to Sales|P/S Multiple BSFC (Blue Star Foods Corp.)|FREE: Market Cap to Revenue Ratio|LANC: Market Cap to Revenue|Market Capitalization-to-Revenue Ratio RGF (Real Good Food)|SNAX: P/S Multiple|Price-to-Sales Ratio SOVO (Sovos Brands Corp)