WYHG: Wing Yip Food Market Cap to Revenue Ratio
Corporate company logo of Wing Yip Food (WYHG)

The price-to-sales multiple demonstrates the revenue valuation trend, where 0.30 captures the current state of the parameter. Stable demand for Wing Yip Food (WYHG) meat semi-finished products is driven by long-term consumer habits. Business efficiency is based on raw material quality and retail network coverage. The company's development relies on expanding its own capacities and direct B2B agreements with Asian distributors.

WYHG: wingyip-food.com P/S Multiple 11/27/2024 - 11/13/2026

Metric breakdowns and analytics for Wing Yip Food (WYHG)
- current quotes and average value forecast:
General company analysis:Wing Yip Food Holdings Group (WYHG)
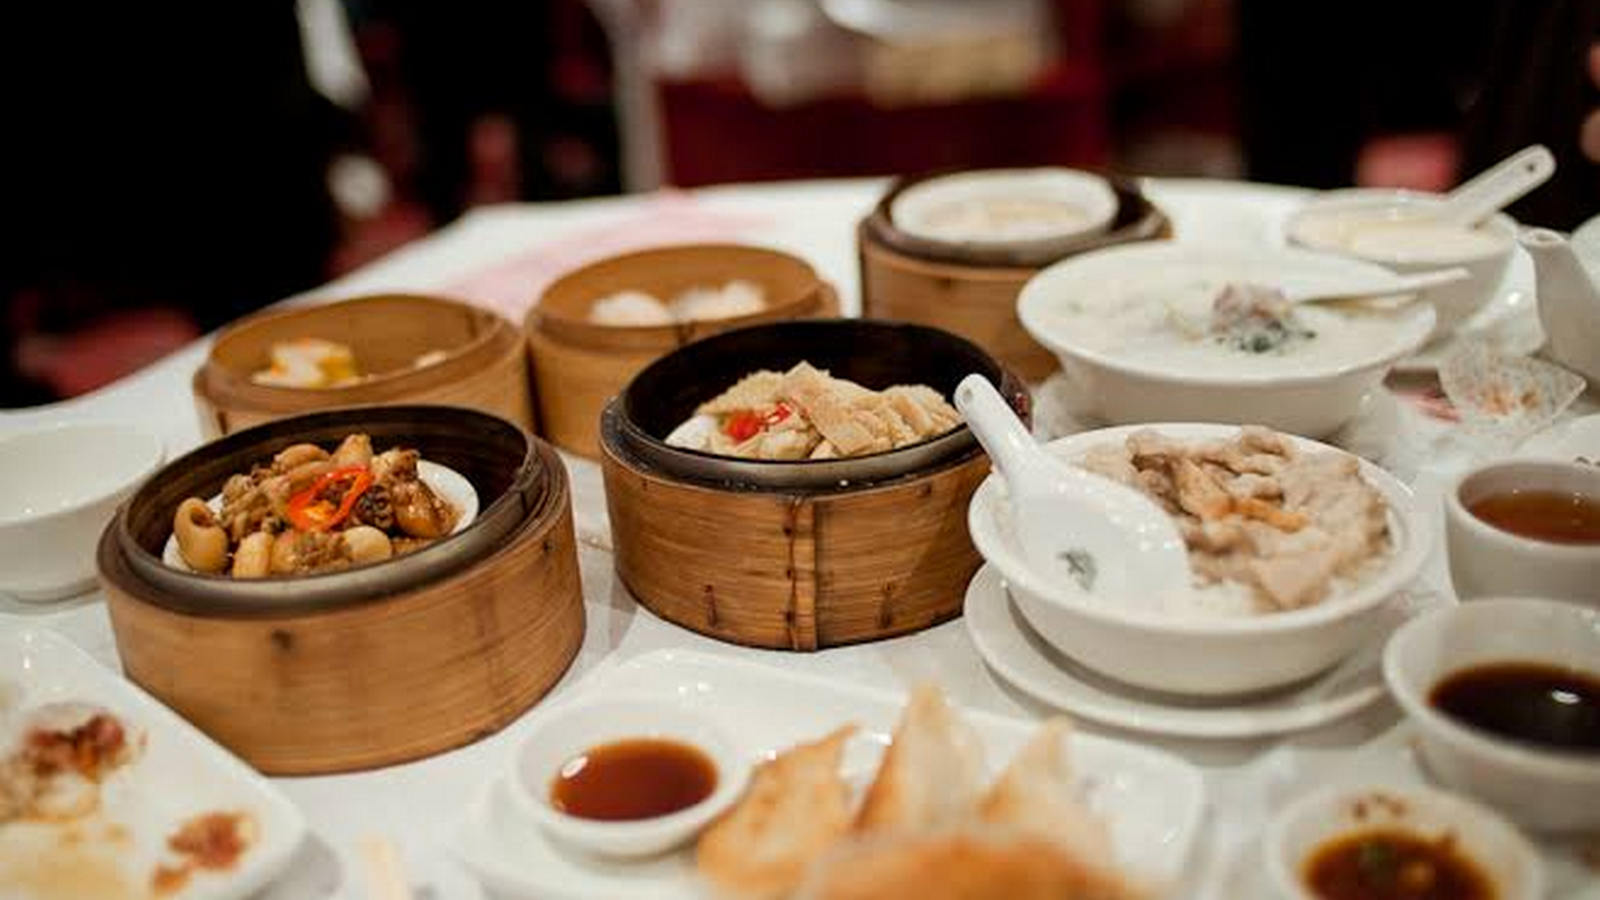
Mass-produced product of Wing Yip Food Group

The P/S ratio reflects the relationship between the market capitalization of Wing Yip Food (WYHG) and its annual revenue, demonstrating the value of a single dollar of sales. This ratio measures the degree of asset overvaluation, signaling potential overheating or an undervalued business. The implementation of ESG standards and resource optimization in the production of processed meat products directly impact operational efficiency and future income. By analyzing the revenue multiple level, an investor can assess the risks of a drawdown relative to industry trends.

Who Wing Yip Food competes with

KHC - Price to Sales|P/S Multiple K (Kellogg's)|GIS: Market Cap to Revenue Ratio|MKC: Market Cap to Revenue|Market Capitalization-to-Revenue Ratio JBS (JBS N.V.)|HRL: P/S Multiple|Price-to-Sales Ratio SJM (jmsmucker.com)|Price-to-Revenue Ratio Pilgrim's Pride Corporation|Price to Sales Campbell Soup CPB|Price-to-Revenue Ratio Smithfield Foods, Inc. (SFD)|INGR - Price to Sales|P/S Multiple LW (Lamb Weston Holdings)|BRFS: Market Cap to Revenue Ratio|POST: Market Cap to Revenue|The Marzetti Company (MZTI) - Market Cap to Revenue|BRBR: P/S Multiple|TR - Price-to-Revenue Coefficient|Price-to-Revenue Ratio Flowers Foods, Inc.|Market Cap to Revenue Ratio SMPL (The Simply Good Foods)|P/S Multiple NOMD|WK Kellogg Corporation (KLG) - Price-to-Revenue Multiple|J&J Snack Foods Corp. - Market Cap to Revenue|Market Capitalization-to-Revenue Ratio UTZ|THS: Market Cap to Revenue|Price to Sales sunopta.com|JBSS: P/S Multiple|SENEA - Price-to-Revenue Coefficient|Price-to-Revenue Ratio Lifeway Kefir|Mama's Creations Corp - Price-to-Sales Ratio|Market Cap to Revenue BGS (B&G Foods, Inc.)|BYND (beyondmeat.com) - Market Capitalization-to-Revenue Ratio|P/S Multiple HAIN (The Hain Celestial Group)|BRID (Bridgford Foods Corp.) - Price-to-Sales Ratio|LSF - Price-to-Revenue Ratio|Price to Sales borealisfoods.ca|farmerbros.com (FARM) - Price-to-Revenue Ratio|Price to Sales BranchOut Food (BOF)|PFAI (Pinnacle Food Group Inc) - P/S Multiple|Market Cap to Revenue Ratio SOWG (Sow Good, Inc.)|Market Cap to Revenue TWG (Top Wealth Group Holding Ltd)|Market Cap to Revenue Steakholder Foods Corp STKH|Blue Star Foods Corp. - Market Cap to Revenue|Whole Earth Brands Inc. (FREE) - Price to Sales|Lancaster Colony Corporation - P/S Multiple|Market Capitalization-to-Revenue Ratio RGF (Real Good Food)|SNAX: P/S Multiple|Price-to-Revenue Multiple Sovos Brands Corp SOVO