UTZ - Utz Brands Market Capitalization-to-Revenue Ratio
Corporate company logo of Utz Brands (UTZ)

Utz Brands, Inc. (UTZ) relies on a loyal workforce and marketing development. The price-to-sales ratio dynamics on GURU.Markets are available for analysis, where the 0.90 indicator expresses the state of the metric. Business success is based on distribution and the control of raw material prices. Stable cash flows are ensured by the demand for affordable snacks, even amidst consumer belt-tightening.

Utz Quality Foods (UTZ) - Price-to-Revenue Ratio from 07/04/2022 to 11/13/2026
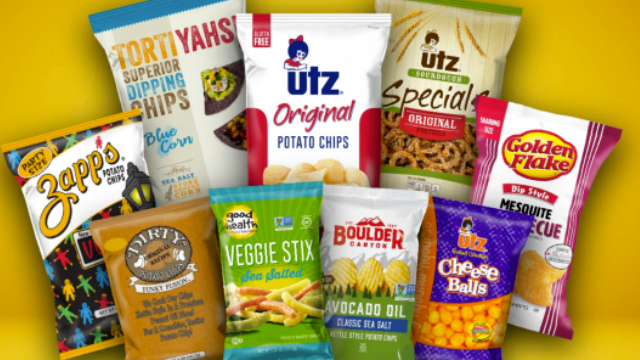
Mass-produced product of utzsnacks.com

The stability of the production core and marketing expansion of Utz Brands, Inc. (UTZ) ensure predictable growth in sales volumes. The ratio of market capitalization to total revenue indicates the cost of each dollar of sales, allowing investors to assess the premium paid for business scaling and manage undervaluation risks via the P/S multiple trend.

Who Utz Brands, Inc. competes with

kraftheinzcompany.com - Market Cap to Revenue Ratio|Kellogg's - Market Cap to Revenue|Market Capitalization-to-Revenue Ratio GIS|McCormick & Co. - P/S Multiple|Price-to-Sales Ratio JBS|Hormel Foods Corporation (HRL) - Price-to-Revenue Ratio|Price to Sales jmsmucker.com (SJM)|Price-to-Revenue Ratio Pilgrim's Pride Corporation|Price to Sales Campbell Soup CPB|P/S Multiple SFD|Corn Products International - Market Cap to Revenue Ratio|Lamb Weston Holdings - Market Cap to Revenue|P/S Multiple brf-global.com BRFS|POST: Market Cap to Revenue|The Marzetti Company - Market Cap to Sales Volume|BRBR (BellRing Brands Inc) - Market Cap to Revenue|Price-to-Sales Ratio TR (Tootsie Roll Corp)|Market Cap to Revenue FLO|SMPL: Market Capitalization-to-Revenue Ratio|P/S Multiple NOMD|Price-to-Revenue Ratio KLG (WK Kellogg Corporation)|Price-to-Revenue Ratio J&J Snack Foods Corp. JJSF|Market Capitalization-to-Revenue Ratio THS|SunOpta Inc. - P/S Multiple|JBSS - P/S Multiple|Seneca Foods Corporation (SENEA) - Price-to-Revenue Ratio|Market Cap to Revenue Ratio LWAY|MAMA (MamaMancini's) - P/S Multiple|Market Cap to Revenue Ratio BGS (B&G Foods Holding)|Price-to-Revenue Ratio Beyond Meat, Inc. (BYND)|Price-to-Revenue Coefficient hain.com|Bridgford Foods Corporation - Market Cap to Revenue|Market Capitalization-to-Revenue Ratio WYHG|Laird Superfood, Inc. - P/S Multiple|Price-to-Revenue Coefficient borealisfoods.ca BRLS|farmerbros.com (FARM) - Price-to-Revenue Ratio|Market Cap to Revenue Ratio BOF|PFAI (Pinnacle Food Group Inc) - P/S Multiple|Market Cap to Revenue Sow Good, Inc. (SOWG)|Market Cap to Revenue TWG (Top Wealth Group Holding Ltd)|Price-to-Revenue Coefficient Steakholder Foods Corp|Blue Star Foods Corp. - Market Cap to Revenue|P/S Multiple Whole Earth Brands Inc. FREE|LANC: Market Cap to Revenue|Real Good Food - Market Cap to Sales Volume|SNAX (Stryve) - Market Cap to Revenue|Price-to-Sales Ratio SOVO (Sovos Brands Corp)