PPC - Pilgrim's Market Capitalization-to-Revenue Ratio
Corporate company logo of Pilgrim's (PPC)

Amid intense pressure from retailers and an oligopoly in the poultry market, the survival of Pilgrim's Pride (PPC) relies on full vertical integration. The historical P/S ratio of the company on the GURU.Markets terminal linear chart captures the current trend, where the indicator stands at 0.40. This necessitates costly cold chain logistics and a shift toward high-value-added products to stabilize margins.

Pilgrim's Corp (PPC) - Price-to-Revenue Ratio from 07/04/2022 to 11/13/2026

Analytical breakdowns for Pilgrim's Corp (PPC)
- stock price and consensus target price:
- market capitalization statistics:
Fundamental company analysis:pilgrims.com - PPC
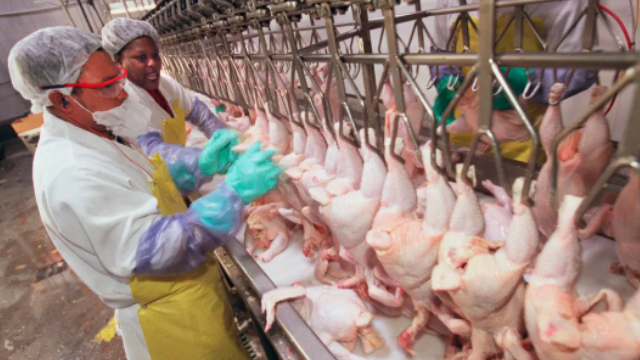
Mass-produced product of pilgrims.com

The P/S ratio determines the investment attractiveness of an asset by comparing the company's market value to its annual revenue to identify whether the stock is overvalued. By analyzing the price-to-sales chart, an investor assesses the monetization efficiency of Pilgrim's Pride (PPC), which is further supported by high capacity utilization and the systemic modernization of technological lines to automate product processing.

Competing companies

kraftheinzcompany.com - Market Cap to Revenue Ratio|Kellogg's - Market Cap to Revenue|Market Capitalization-to-Revenue Ratio GIS|McCormick & Co. - P/S Multiple|Price-to-Sales Ratio JBS|Hormel Foods Corporation (HRL) - Price-to-Revenue Ratio|Price to Sales jmsmucker.com (SJM)|Price-to-Revenue Ratio Campbell's|Price to Sales Smithfield SFD|P/S Multiple INGR|Lamb Weston Inc. - Market Cap to Revenue Ratio|Price-to-Revenue Ratio BRF S.A. BRFS|POST (postholdings.com) - Price-to-Sales Ratio|T. Marzetti - P/S Multiple|Price-to-Revenue Coefficient Premier Protein BRBR|Tootsie Roll Industries Inc (TR) - Price-to-Revenue Ratio|FLO (Flowers Foods Corp) - Price-to-Revenue Ratio|SMPL (Quest Nutrition) - P/S Multiple|NOMD - Price-to-Revenue Multiple|Price-to-Revenue Ratio WK Kellogg (KLG)|JJSF (J&J Snack Foods Corp) - Market Capitalization-to-Revenue Ratio|P/S Multiple UTZ (Utz Quality Foods)|Price-to-Revenue Coefficient TreeHouse Foods Inc. (THS)|STKL - Price-to-Revenue Ratio|John B. Sanfilippo & Son (JBSS) - Market Cap to Revenue|Seneca Foods Corporation (SENEA) - Price-to-Revenue Ratio|LWAY - Price-to-Revenue Coefficient|Market Cap to Revenue MAMA|BGS: Market Capitalization-to-Revenue Ratio|Price-to-Revenue Ratio Beyond Meat, Inc. (BYND)|HAIN: Price-to-Sales Ratio|Price-to-Revenue Ratio Bridgford Foods Corporation BRID|Market Capitalization-to-Revenue Ratio WYHG|Laird Superfood, Inc. - P/S Multiple|Price-to-Revenue Coefficient borealisfoods.ca BRLS|FARM: P/S Multiple|Market Cap to Revenue Ratio BOF|PFAI (Pinnacle Food Group Inc) - P/S Multiple|Price to Sales Sow Good, Inc. SOWG|Price-to-Revenue Ratio Top Wealth Group Holding Ltd (TWG)|STKH: Price-to-Sales Ratio|Price-to-Revenue Ratio Blue Star Foods Corp. BSFC|FREE (Whole Earth Brands Inc.) - Price-to-Sales Ratio|Lancaster Colony Corporation - P/S Multiple|Real Good Food (RGF) - Market Cap to Revenue|Stryve (SNAX) - Price-to-Revenue Ratio|SOVO - Price-to-Revenue Coefficient