KHC - Kraft Heinz Company Market Capitalization-to-Revenue Ratio
Corporate company logo of Kraft Heinz Company (KHC)

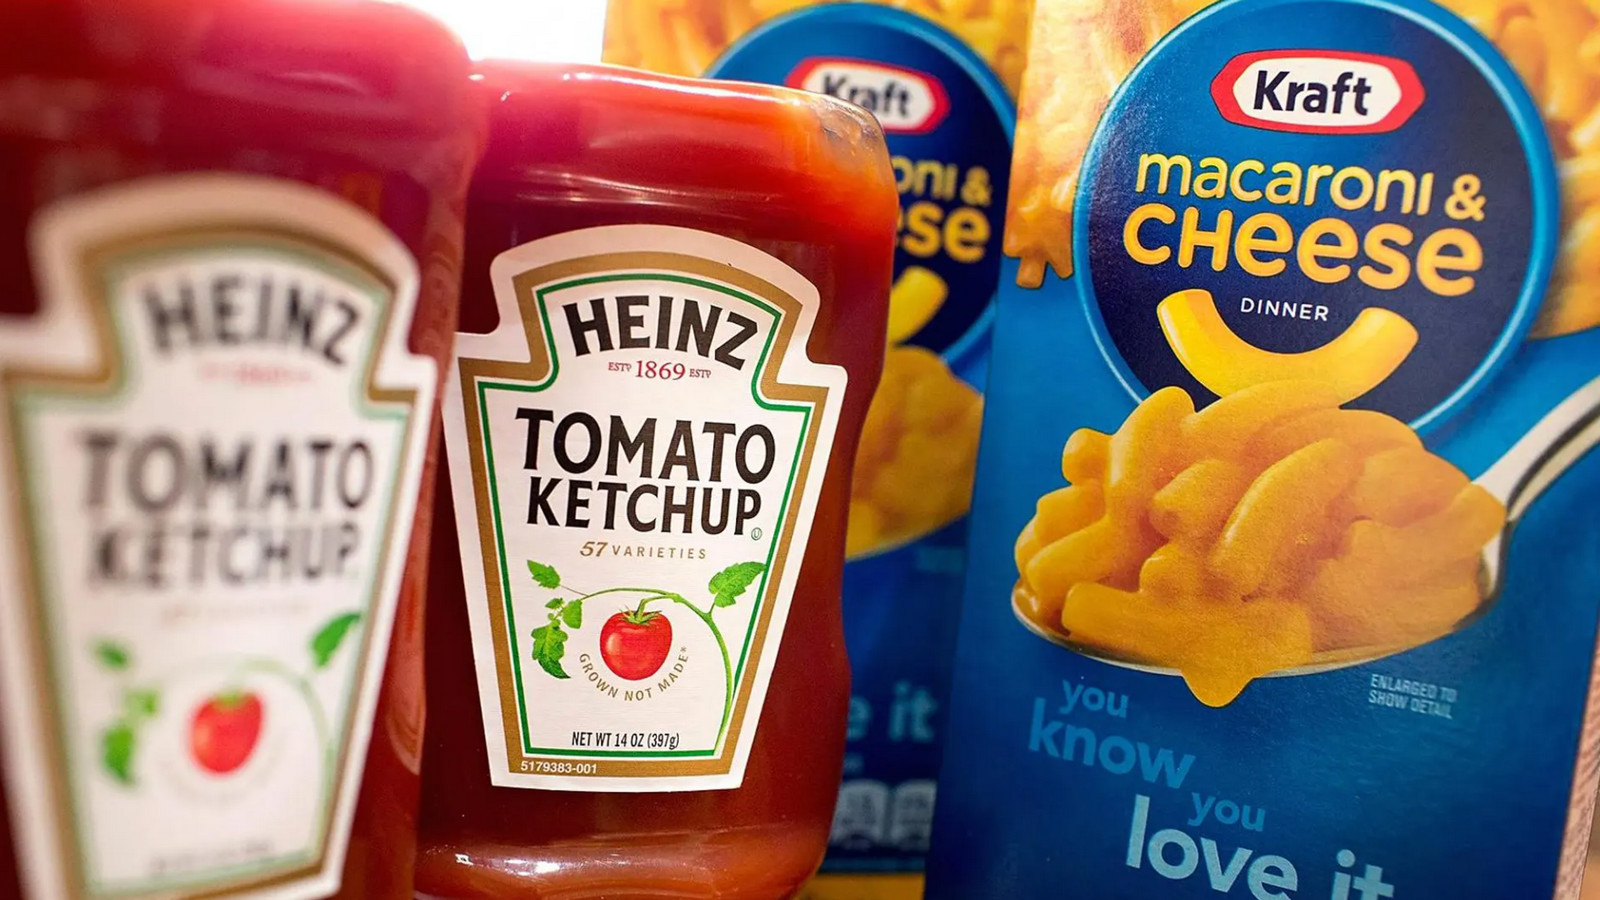
The Kraft Heinz Company (KHC) is constrained by the aftermath of a failed merger, focusing instead on organic position retention. Carlos Abrams-Rivera is refreshing the portfolio, stabilizing profitability through flexible pricing. The company's smoothed P/S ratio demonstrates the market valuation of revenue, where the value of 1.20 reflects the metric's balance. Iconic sauces create enduring consumer inertia, turning the business into a stable cash cow, as confirmed by the chart's price action.

Kraft Heinz Corp (KHC) - Price-to-Revenue Ratio from 07/04/2022 to 11/18/2026

Analytical breakdowns for Kraft Heinz (KHC)
- stock price and consensus target price:
- market capitalization statistics:
Summary company analytics:Kraft Heinz
Mass-produced product of kraftheinzcompany.com

Stable demand for Heinz and Kraft brands allows for an assessment of the monetization efficiency of The Kraft Heinz Company (KHC) global procurement scale via the market-to-sales ratio. This metric correlates market capitalization with annual turnover to determine how much an investor pays per unit of sales, helping to identify market distortions and confirm the fundamental resilience of assets during any crisis.

Competing companies

K: Price-to-Sales Ratio|General Mills Corp - Market Cap to Revenue|Market Capitalization-to-Revenue Ratio MKC|JBS N.V. - P/S Multiple|Price-to-Sales Ratio HRL|The J.M. Smucker Co. (SJM) - Price-to-Revenue Ratio|Price to Sales Pilgrim's (PPC)|Price-to-Revenue Ratio campbellsoupcompany.com|Price to Sales Smithfield Foods, Inc. SFD|Price-to-Revenue Ratio Ingredion Inc. (INGR)|Price-to-Revenue Ratio LW (Lamb Weston Holdings)|P/S Multiple BRFS (Sadia)|POST: Market Cap to Revenue Ratio|MZTI: Market Cap to Revenue|BRBR: Price-to-Revenue Ratio|TR (Tootsie Roll Industries Inc) - Market Cap to Revenue|Price to Sales Flowers Foods (FLO)|SMPL (Simply Good Foods Co.) - P/S Multiple|Market Cap to Revenue Nomad Foods (NOMD)|P/S Multiple KLG|JJSF (J&J Snack Foods Inc) - Market Capitalization-to-Revenue Ratio|Price-to-Revenue Ratio Utz Brands, Inc. UTZ|TreeHouse Foods (THS) - Price to Sales|STKL: Market Cap to Revenue|JBSS: Price-to-Revenue Ratio|SENEA: P/S Multiple|Price to Sales Lifeway Foods, Inc. (LWAY)|Price-to-Revenue Ratio Mama's Creations, Inc.|B&G Foods (BGS) - Price-to-Revenue Coefficient|P/S Multiple BYND|HAIN (The Hain Celestial Group) - Market Capitalization-to-Revenue Ratio|Bridgford Foods Corp - Market Cap to Revenue|WYHG (Wing Yip Food) - Price-to-Sales Ratio|Laird Superfood - P/S Multiple|Price to Sales Borealis Foods, Inc.|FARM (Farmer Bros. Co.) - Market Cap to Revenue|Price to Sales BranchOut Food, Inc. (BOF)|PFAI (Pinnacle Food Group Inc.) - P/S Multiple|thisissowgood.com (SOWG) - Price-to-Revenue Coefficient|Market Cap to Revenue TWG (Top Wealth Group Ltd)|STKH - Price to Sales|Price-to-Revenue Ratio bluestarfoods.com BSFC|P/S Multiple Whole Earth Brands FREE|LANC: Market Cap to Revenue|Price to Sales The Real Good Food Company Inc.|SNAX (stryve.com) - Market Cap to Revenue|SOVO - Price-to-Revenue Coefficient