BRID: Bridgford Market Cap to Revenue Ratio
Corporate company logo of Bridgford Foods Corp (BRID)

The price-to-sales multiple helps evaluate the business value of Bridgford Foods (BRID), where 0.20 captures the current state of the parameter. This trend confirms the maturity of Bridgford Foods, which relies on stable supplies and the high demand for meat snacks. The brand maintains its position amidst fierce competition through plant automation. A strong image and extensive US retail coverage ensure steady demand for the company's affordable convenience foods.

BRID: Bridgford P/S Multiple 07/04/2022 - 11/17/2026

Metric breakdowns and analytics for Bridgford Foods Corp. (BRID)
General company analysis:Bridgford Foods Corporation (BRID)
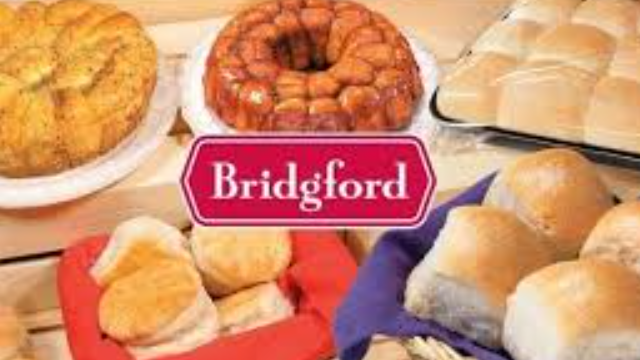
Mass-produced product of Bridgford Foods Corporation

Bridgford Foods (BRID) leadership in the meat snacks and bakery segment determines the scale of cash flows, which are evaluated via the estimated price-to-sales ratio. This metric compares the current market value of the business with its gross revenue, measuring the cost of every dollar of sales. The price-to-sales ratio trend reflects the market equilibrium between capitalization and actual sales volume. Current indicator values demonstrate investor consensus regarding investment attractiveness and the potential risks of capital freeze.

Competing companies

Kraft Heinz Corp - Market Cap to Revenue Ratio|Price-to-Revenue Ratio kelloggcompany.com K|Market Capitalization-to-Revenue Ratio GIS|McCormick & Co. - P/S Multiple|Price-to-Sales Ratio JBS|Hormel Corp (HRL) - Price-to-Revenue Ratio|Price to Sales J.M. Smucker (SJM)|Price-to-Revenue Ratio pilgrims.com|Price to Sales Campbell Soup Co. CPB|P/S Multiple SFD|INGR - Price to Sales|P/S Multiple LW (lambweston.com)|BRFS: Market Cap to Revenue Ratio|POST - Price-to-Revenue Ratio|T. Marzetti Company - Market Cap to Sales Volume|BRBR: P/S Multiple|TR: Market Cap to Sales Volume|Market Cap to Revenue FLO|Price to Sales The Simply Good Foods Company SMPL|P/S Multiple NOMD|KLG - Price to Sales|Price-to-Revenue Ratio jjsnack.com JJSF|Market Capitalization-to-Revenue Ratio UTZ|THS: Market Cap to Revenue|SunOpta - Market Cap to Sales Volume|JBSS (John B. Sanfilippo & Son) - Market Cap to Revenue|Seneca Foods (SENEA) - P/S Multiple|Market Cap to Revenue LWAY|MAMA: Market Capitalization-to-Revenue Ratio|Market Cap to Revenue BGS (B&G Foods)|BYND - Price to Sales|P/S Multiple HAIN (Hain Celestial Group)|WYHG (Wing Yip Food) - Price-to-Sales Ratio|Laird Superfood - P/S Multiple|Price to Sales Borealis Foods, Inc.|FARM (Farmer Bros. Co.) - Market Cap to Revenue|Price to Sales BranchOut Food, Inc. (BOF)|PFAI (Pinnacle Food Group Inc.) - P/S Multiple|thisissowgood.com (SOWG) - Price-to-Revenue Coefficient|Market Cap to Revenue TWG (Top Wealth Group Ltd)|STKH - Price to Sales|Price-to-Revenue Ratio bluestarfoods.com BSFC|P/S Multiple Whole Earth Brands FREE|LANC: Market Cap to Revenue|Price to Sales The Real Good Food Company Inc.|SNAX (stryve.com) - Market Cap to Revenue|SOVO - Price-to-Revenue Coefficient