BYND: Beyond Meat, Inc. Market Cap to Revenue Ratio
Corporate company logo of Beyond Meat, Inc. (BYND)

Patent protection for protein extrusion and costly marketing create high barriers to entry for competitors, which is reflected in the historical P/S dynamics on the GURU.Markets chart for Beyond Meat, Inc. (BYND). Moderate cyclicality and summer demand influence volatility, while waning interest in plant-based meat combined with a cash shortage weigh on the share price. The value of 0.40 serves as the current metric level.

BYND: beyondmeat.com P/S Multiple 07/04/2022 - 11/13/2026

Metric breakdowns and analytics for Beyond Meat, Inc. (BYND)
- current quotes and average value forecast:
General company analysis:Beyond Meat Inc (BYND)
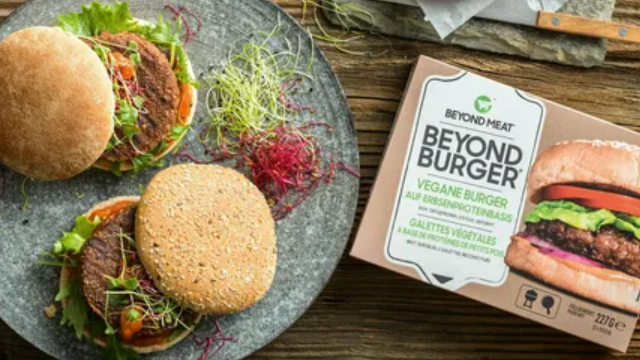
Mass-produced product of Beyond Burger

Beyond Meat, Inc. (BYND) faces a complex challenge in balancing operational risks with return on equity due to its reliance on protein imports, where geopolitical barriers and logistical disruptions drive up the cost of goods sold. By analyzing the company's price-to-sales ratio, an investor assesses the market value of each dollar of revenue, enabling a comparison of the current valuation against historical volatility to determine the business's resilience to external shocks.

Competing companies

KHC - Price to Sales|P/S Multiple K (Kellogg's)|GIS: Market Cap to Revenue Ratio|MKC: Market Cap to Revenue|Market Capitalization-to-Revenue Ratio JBS (JBS N.V.)|HRL: P/S Multiple|Price-to-Sales Ratio SJM (jmsmucker.com)|Price-to-Revenue Ratio Pilgrim's Pride Corporation|Price to Sales Campbell Soup CPB|Price-to-Revenue Ratio Smithfield Foods, Inc. (SFD)|INGR - Price to Sales|P/S Multiple LW (Lamb Weston Holdings)|BRFS: Market Cap to Revenue Ratio|Post Holdings - P/S Multiple|MZTI: Price-to-Revenue Ratio|BRBR: P/S Multiple|Price to Sales Tootsie Roll Corp (TR)|Market Cap to Revenue FLO|Price to Sales The Simply Good Foods SMPL|Price-to-Revenue Ratio Nomad Foods (NOMD)|KLG - Price to Sales|Price-to-Revenue Ratio J&J Snack Foods Corp. JJSF|UTZ: Market Cap to Revenue Ratio|TreeHouse Foods, Inc. - P/S Multiple|STKL (sunopta.com) - Market Cap to Revenue Ratio|JBSS (jbssinc.com) - Market Cap to Revenue|Seneca Foods Corp - Market Capitalization-to-Revenue Ratio|Price-to-Revenue Ratio Lifeway Kefir|Market Cap to Revenue Mama's Creations Corp (MAMA)|P/S Multiple BGS|HAIN - Price to Sales|P/S Multiple BRID (Bridgford Foods Corporation)|P/S Multiple Wing Yip Food Holdings Group WYHG|LSF: Market Cap to Revenue|borealisfoods.ca - Market Cap to Sales Volume|FARM (farmerbros.com) - Market Cap to Revenue|BranchOut Food - Market Capitalization-to-Revenue Ratio|PFAI (Pinnacle Food Group Inc) - P/S Multiple|Sow Good, Inc. (SOWG) - Price-to-Revenue Coefficient|Price-to-Revenue Ratio Top Wealth Group Holding Ltd (TWG)|Steakholder Foods Corp - Market Cap to Revenue Ratio|P/S Multiple BSFC (Blue Star Foods Corp.)|FREE - Market Cap to Revenue|LANC: Market Cap to Revenue|Price-to-Revenue Coefficient Real Good Food RGF|SNAX: P/S Multiple|SOVO (Sovos Brands Corp) - Price-to-Revenue Ratio