JBS - JBS USA Market Capitalization-to-Revenue Ratio
Corporate company logo of JBS Group (JBS)

JBS N.V. (JBS) business is subject to moderate cyclicality due to fluctuations in feed and livestock costs. Stability is ensured by a global network of plants and logistics hubs. Raw material risks are mitigated by delegating livestock breeding to farmers through strict contracts. The company's price/sales multiple clearly separates price action from actual sales, while 0.10 records a new level.

JBS N.V. (JBS) - Price-to-Revenue Ratio from 06/14/2025 to 11/13/2026
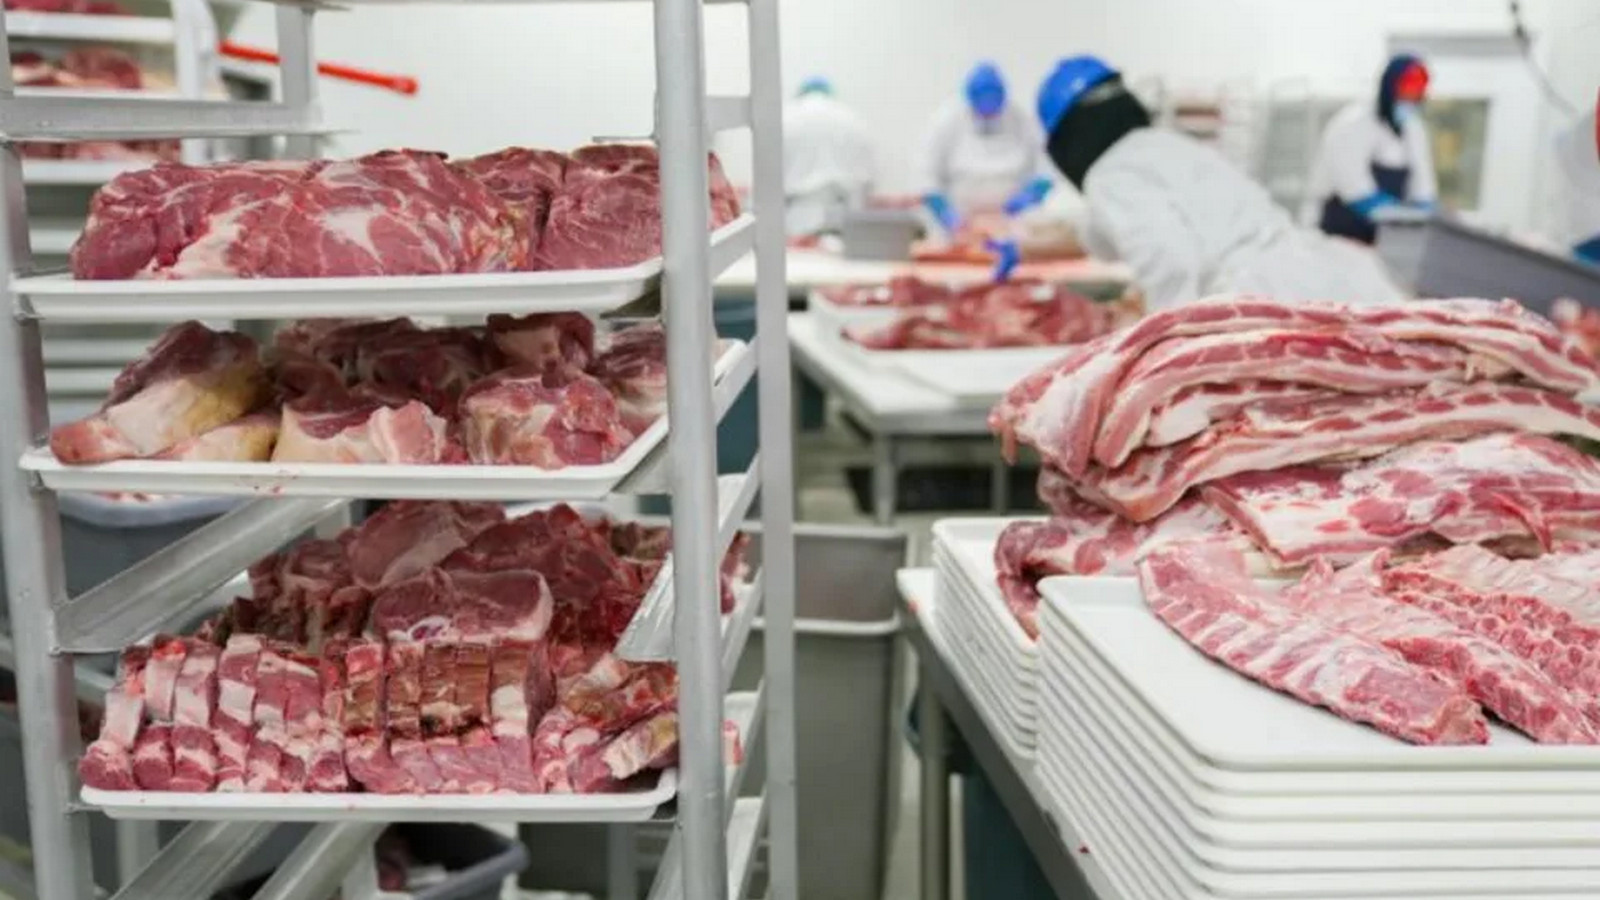
Mass-produced product of JBS USA

Stable demand for JBS N.V. meat products minimizes the impact of macro shocks, making revenue a reliable basis for valuation. By analyzing the P/S multiple, an investor correlates the business's market value with sales volume: a decrease in this ratio often signals that the asset is undervalued and that potential returns are increasing, provided the decline is not caused by a systemic contraction in market demand.

Competing companies

kraftheinzcompany.com - Market Cap to Revenue Ratio|Kellogg's - Market Cap to Revenue|Market Capitalization-to-Revenue Ratio GIS|McCormick & Co. - P/S Multiple|Price-to-Sales Ratio HRL|The J. M. Smucker Company (SJM) - Price-to-Revenue Ratio|Price to Sales pilgrims.com (PPC)|Price-to-Revenue Ratio Campbell's|Price to Sales Smithfield SFD|P/S Multiple INGR|Lamb Weston Inc. - Market Cap to Revenue Ratio|Price-to-Revenue Ratio BRF S.A. BRFS|Market Cap to Sales Volume POST (postholdings.com)|T. Marzetti - P/S Multiple|BRBR: Price-to-Revenue Ratio|Tootsie Roll Industries Inc (TR) - Price-to-Revenue Ratio|FLO - Price-to-Revenue Coefficient|Market Cap to Revenue SMPL|NOMD: Market Capitalization-to-Revenue Ratio|Price-to-Revenue Ratio WK Kellogg (KLG)|J&J Snack Foods Corp - Market Cap to Revenue Ratio|Utz Quality Foods - Market Cap to Revenue|Price-to-Revenue Coefficient TreeHouse Foods Inc. (THS)|STKL: Market Cap to Revenue|JBSS: Price-to-Revenue Ratio|SENEA (Seneca Foods Corporation) - Market Cap to Revenue|LWAY - Price-to-Revenue Coefficient|Price-to-Revenue Ratio MamaMancini's|BGS (B&G Foods Holding) - Market Cap to Sales Volume|P/S Multiple BYND|Price-to-Revenue Ratio HAIN (hain.com)|Price-to-Revenue Ratio Bridgford Foods Corporation BRID|Price-to-Revenue Coefficient Wing Yip Food Holdings Group (WYHG)|LSF - Price-to-Revenue Ratio|Price-to-Revenue Coefficient borealisfoods.ca BRLS|FARM: P/S Multiple|Price to Sales BranchOut Food (BOF)|Price-to-Revenue Ratio Pinnacle Food Group Inc|Market Cap to Revenue Sow Good, Inc. (SOWG)|P/S Multiple TWG|Price-to-Revenue Coefficient Steakholder Foods Corp|Blue Star Foods Corp. - Market Cap to Revenue|Price-to-Revenue Multiple Whole Earth Brands Inc.|Lancaster Colony Corporation - P/S Multiple|Price-to-Sales Ratio RGF|SNAX: P/S Multiple|SOVO - Price-to-Revenue Coefficient