JJSF: J&J Snack Foods Inc Market Cap to Revenue Ratio
Corporate company logo of J&J Snack Foods Corp. (JJSF)

J&J Snack Foods supplies popular snacks and beverages to supermarkets and stadiums, occupying a stable niche within the leisure sector. The revenue multiple reflects the business valuation trend, where the value 1.10 represents the most recent figure. A high degree of line automation minimizes manual labor, although raw material price volatility may impact final production profitability.

JJSF: J&J Snack Foods Inc P/S Multiple 07/04/2022 - 11/13/2026

Metric breakdowns and analytics for J&J Snack Foods Corp. (JJSF)
- current quotes and average value forecast:
General company analysis:jjsnack.com (JJSF)
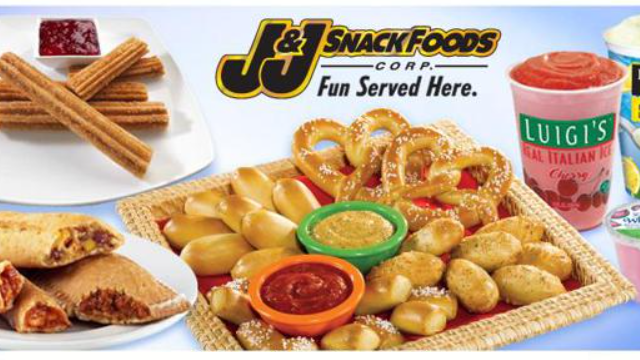
Mass-produced product of J & J Snack Foods Corp.

To identify fundamental benchmarks in the financial statements of J&J Snack Foods (JJSF), it is critical to compare market capitalization with actual revenue. By analyzing the P/S multiple chart, where the current value is 1.10, an investor assesses the cost of every dollar of sales, which helps determine the degree of business overvaluation during the scaling of distribution and the automation of frozen snack production.

Competitors of J&J Snack Foods

KHC - Price to Sales|P/S Multiple K (Kellogg's)|GIS: Market Cap to Revenue Ratio|MKC: Market Cap to Revenue|Market Capitalization-to-Revenue Ratio JBS (JBS N.V.)|HRL: P/S Multiple|Price-to-Sales Ratio SJM (jmsmucker.com)|Price-to-Revenue Ratio Pilgrim's Pride Corporation|Price to Sales Campbell Soup CPB|Price-to-Revenue Ratio Smithfield Foods, Inc. (SFD)|INGR - Price to Sales|P/S Multiple LW (Lamb Weston Holdings)|BRFS: Market Cap to Revenue Ratio|POST - Price-to-Revenue Ratio|The Marzetti Company - Market Cap to Sales Volume|Market Cap to Revenue Ratio BellRing Brands Inc|TR: Market Cap to Sales Volume|Price-to-Revenue Ratio Flowers Foods, Inc.|SMPL (The Simply Good Foods) - Market Cap to Sales Volume|Market Cap to Revenue NOMD (Nomad Foods)|KLG (WK Kellogg Corporation) - Market Capitalization-to-Revenue Ratio|Price-to-Revenue Ratio Utz Quality Foods UTZ|Price-to-Revenue Coefficient TreeHouse Foods Inc. (THS)|STKL - Price-to-Revenue Ratio|JBSS (John B. Sanfilippo & Son) - Market Cap to Revenue Ratio|SENEA: P/S Multiple|Lifeway Foods Inc (LWAY) - P/S Multiple|MAMA (MamaMancini's) - P/S Multiple|Market Cap to Revenue B&G Foods Holding (BGS)|Price-to-Revenue Ratio Beyond Meat, Inc. (BYND)|P/S Multiple hain.com (HAIN)|Bridgford Foods Corporation - Market Cap to Revenue|Market Capitalization-to-Revenue Ratio WYHG|Laird Superfood, Inc. - P/S Multiple|Price-to-Sales Ratio BRLS|farmerbros.com (FARM) - Price-to-Revenue Ratio|Price to Sales BranchOut Food (BOF)|Price-to-Revenue Ratio Pinnacle Food Group Inc|Price to Sales Sow Good, Inc. SOWG|P/S Multiple TWG|Steakholder Foods Corp - Market Cap to Revenue Ratio|Price-to-Revenue Ratio Blue Star Foods Corp. BSFC|Price-to-Revenue Coefficient Whole Earth Brands Inc. (FREE)|LANC - Price-to-Revenue Ratio|Real Good Food - Market Cap to Sales Volume|Stryve (SNAX) - Price-to-Revenue Ratio|SOVO: Market Cap to Sales Volume