LSF - lairdsuperfood.com Market Capitalization-to-Revenue Ratio
Corporate company logo of Laird Superfood Inc. (LSF)

Laird Superfood, Inc. (LSF) generates revenue through the mass production of plant-based products, selling coconut cream and superfoods via online platforms and retail. This P/S chart clearly illustrates market expectations, where 0.30 serves as the current metric level. Volatile cash flows are driven by intense competition within the niche. To mitigate the risks of narrow specialization, the company is expanding its range of functional supplements.

Laird Superfood, Inc. (LSF) - Price-to-Revenue Ratio from 07/04/2022 to 11/14/2026

Analytical breakdowns for Laird Superfood, Inc. (LSF)
- stock price and consensus target price:
- market capitalization statistics:
Fundamental company analysis:Laird Superfood Inc. LSF
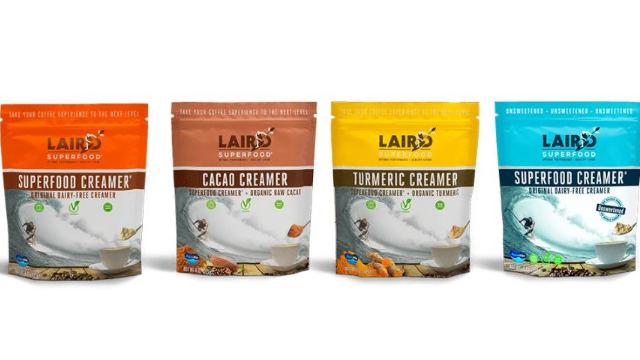
Mass-produced product of Laird Superfood Inc.

Amid market volatility, investors must identify reliable criteria for capital protection. For Laird Superfood, Inc. (LSF), stability is driven by retail expansion and the optimization of direct sales margins. The price-to-sales ratio, represented by the P/S multiple, measures the market value of every dollar of revenue. Analysis of this chart allows for an assessment of the asset's fundamental undervaluation for a long-term portfolio.

Competing companies

kraftheinzcompany.com - Market Cap to Revenue Ratio|Kellogg's - Market Cap to Revenue|Market Capitalization-to-Revenue Ratio GIS|McCormick & Co. - P/S Multiple|Price-to-Sales Ratio JBS|Hormel Foods Corporation (HRL) - Price-to-Revenue Ratio|Price to Sales jmsmucker.com (SJM)|Price-to-Revenue Ratio Pilgrim's Pride Corporation|Price to Sales Campbell Soup CPB|P/S Multiple SFD|Corn Products International - Market Cap to Revenue Ratio|Price-to-Revenue Ratio Lamb Weston Holdings LW|brf-global.com - Price-to-Revenue Ratio|Post Holdings - P/S Multiple|MZTI - P/S Multiple|BRBR: P/S Multiple|TR - Price-to-Revenue Coefficient|Price-to-Revenue Ratio Flowers Foods, Inc.|SMPL: Market Capitalization-to-Revenue Ratio|P/S Multiple NOMD|WK Kellogg Corporation - Market Cap to Revenue Ratio|J&J Snack Foods Corp. - Market Cap to Revenue|Market Capitalization-to-Revenue Ratio UTZ|THS - Price-to-Revenue Ratio|Price-to-Revenue Coefficient sunopta.com STKL|JBSS (jbssinc.com) - Market Cap to Revenue|Seneca Foods Corp (SENEA) - P/S Multiple|Price-to-Revenue Ratio Lifeway Kefir|Mama's Creations Corp - Price-to-Sales Ratio|P/S Multiple BGS|BYND - Price to Sales|Price-to-Revenue Ratio The Hain Celestial Group HAIN|Market Capitalization-to-Revenue Ratio BRID|Wing Yip Food Group - P/S Multiple|Price-to-Sales Ratio BRLS|farmerbros.com (FARM) - Price-to-Revenue Ratio|Price to Sales BranchOut Food (BOF)|Price-to-Revenue Ratio Pinnacle Food Group Inc|Price to Sales Sow Good, Inc. SOWG|P/S Multiple TWG|Steakholder Foods Corp - Market Cap to Revenue Ratio|Blue Star Foods Corp. - Market Cap to Revenue|Market Capitalization-to-Revenue Ratio FREE|Lancaster Colony Corporation - P/S Multiple|Price-to-Revenue Coefficient Real Good Food RGF|Stryve (SNAX) - Price-to-Revenue Ratio|Market Cap to Revenue Ratio SOVO