STKH: Steakholder Foods Corp Market Cap to Revenue Ratio
Corporate company logo of MeaTech 3D (STKH)

The price-to-sales ratio reflects the valuation dynamics of Steakholder Foods Ltd. (STKH), where 7.00 represents the latest level. The delivery of bio-inks and complex printing systems minimizes food-tech risks. The business model relies on third-party equipment assemblers, while the development strategy is based on creating sustainable, carbon-free meat production to replace traditional livestock farming.

STKH: Steakholder Foods Corp P/S Multiple 04/04/2025 - 05/08/2026

Metric breakdowns and analytics for Steakholder Foods Ltd (STKH)
- current quotes and average value forecast:
General company analysis:Steakholder Foods Ltd (STKH)
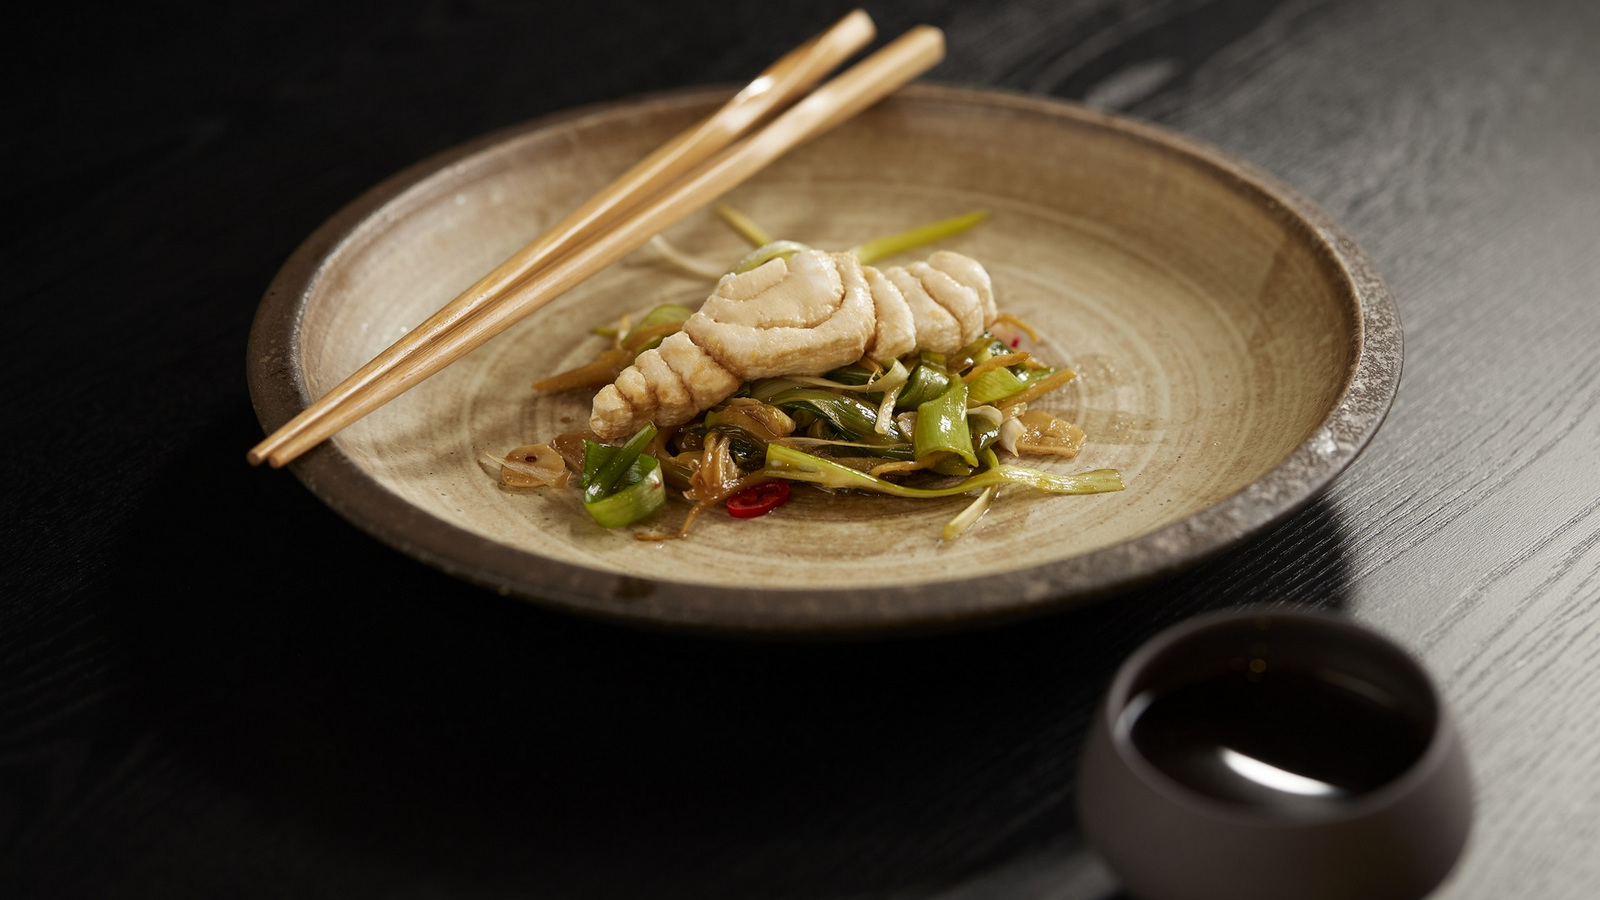
Mass-produced product of Steakholder Foods

The P/S ratio compares market capitalization to annual revenue, allowing investors to assess the value of each unit of revenue and identify asset overheating regardless of accounting cycles. Analyzing the price-to-sales ratio is critically important for Steakholder Foods Ltd. (STKH), as the current valuation is based on the patent potential of 3D bioprinting, while commercial implementation and cost reductions are only beginning to build a market moat.

Competitors of Steakholder Foods Ltd.

Kraft Heinz Corp - Market Cap to Revenue Ratio|Price-to-Revenue Ratio kelloggcompany.com K|Market Capitalization-to-Revenue Ratio GIS|McCormick & Co. - P/S Multiple|Price-to-Sales Ratio JBS|Hormel Corp (HRL) - Price-to-Revenue Ratio|Price to Sales J.M. Smucker (SJM)|Price-to-Revenue Ratio pilgrims.com|Price to Sales Campbell Soup Co. CPB|P/S Multiple SFD|INGR - Price to Sales|P/S Multiple LW (lambweston.com)|BRFS: Market Cap to Revenue Ratio|POST - Price-to-Revenue Ratio|T. Marzetti Company - Market Cap to Sales Volume|BRBR: P/S Multiple|TR: Market Cap to Sales Volume|Market Cap to Revenue FLO|Price to Sales The Simply Good Foods Company SMPL|P/S Multiple NOMD|KLG - Price to Sales|Price-to-Revenue Ratio jjsnack.com JJSF|Market Capitalization-to-Revenue Ratio UTZ|THS: Market Cap to Revenue|SunOpta - Market Cap to Sales Volume|JBSS (John B. Sanfilippo & Son) - Market Cap to Revenue|Seneca Foods (SENEA) - P/S Multiple|Market Cap to Revenue LWAY|MAMA: Market Capitalization-to-Revenue Ratio|Market Cap to Revenue BGS (B&G Foods)|BYND - Price to Sales|P/S Multiple HAIN (Hain Celestial Group)|Market Capitalization-to-Revenue Ratio BRID|WYHG - Price-to-Revenue Ratio|Price-to-Sales Ratio LSF|Borealis Foods, Inc. (BRLS) - Price-to-Revenue Ratio|FARM - Price-to-Revenue Coefficient|BOF (BranchOut Food) - P/S Multiple|Market Cap to Revenue Ratio PFAI (Pinnacle Food Group Inc.)|Price-to-Revenue Ratio Sow Good, Inc. (SOWG)|P/S Multiple imperialcristalcaviar.com (TWG)|Price-to-Revenue Ratio bluestarfoods.com BSFC|P/S Multiple Whole Earth Brands FREE|LANC: Market Cap to Revenue|Price to Sales The Real Good Food Company Inc.|SNAX (stryve.com) - Market Cap to Revenue|SOVO - Price-to-Revenue Coefficient